
SUMMARY
- Public health arguments justifying the implementation of the Nutri-Score
1.1. The burden of major public health issues related to nutrition
1.2. The importance of providing consumers with understandable information about the nutritional quality of foods to combat nutrition-related chronic diseases
____________________________________________________________________ - How the Nutri-Score is calculated: a calculation algorithm based on solid scientific foundations
2.1. Choice of nutrients and nutritional elements considered in the Nutri-Score calculation algorithm
2.2. Allocation of positive and negative points in the calculation of the Nutri-Score
2.3. A universal method for calculating the Nutri-Score for all foods (with a small number of exceptions)
____________________________________________________________________ - How the Nutri-Score works to help consumers compare the overall nutritional quality of foods at the time of purchase
3.1. Purpose of the Nutri-Score
3.2. Practical use of the Nutri-Score
3.2.1. Comparing differences in nutritional quality of foods belonging to the same category
3.2.2. Comparing differences in nutritional quality for the same food offered by different brands
3.2.3. Comparing differences in nutritional quality of foods belonging to different categories but having the same usage conditions, the same use, or the same consumption purpose
3.3. The Nutri-Score provides information at the food level; it does not replace general public health nutritional recommendations but complements them
____________________________________________________________________ - A public health tool validated by numerous solid scientific studies
4.1. Validation of the algorithm, the nutritional profiling system underlying the Nutri-Score
4.1.1. The algorithm’s ability to correctly classify foods
4.1.2. Validation of the Nutri-Score calculation algorithm concerning food consumption, nutrient intake, and nutritional status biomarkers
4.1.3. Prospective association of the Nutri-Score calculation algorithm at the individual level with health criteria
4.2. Validation of the graphical format of the Nutri-Score
4.2.1. Perception, attractiveness, and preferences
4.2.2. Objective understanding and impact on reported food choice decisions
4.2.3. Impact on purchasing intentions and on the nutritional quality of food purchases
4.3. Analysis by the Joint Research Centre of the European Commission on the effectiveness of different nutritional labels
4.4. The European Commission’s public consultation on nutritional information systems: the opinions of various stakeholders
4.5. Measuring the expected impact of the Nutri-Score and other nutritional labels in terms of chronic disease incidence, mortality, and various socio-demographic indicators
4.6. Impact of Nutri-Score display in advertisements
____________________________________________________________________ - What can (or cannot) the Nutri-Score provide?
5.1. The calculation of the Nutri-Score, in its current form, provides information solely on the nutritional quality of foods and does not incorporate other health dimensions of foods
5.2. Nutri-Score cannot include all nutrients of interest contained in foods in its calculation: vitamins, minerals, polyphenols, free sugars, different types of fatty acids, etc.
5.3. Nutri-Score does not provide information on the nutritional quality of a portion of the food.
____________________________________________________________________ - The deployment of the Nutri-Score in France
6.1. Adoption of the Nutri-Score by economic stakeholders
6.2. Adoption of the Nutri-Score by consumers
6.3. Effects on sales
6.4. Effect on reformulations
6.5. Extension of the Nutri-Score to collective catering
6.6. Extension to foods sold in bulk
6.7. Support for the Nutri-Score to make it mandatory on foods
____________________________________________________________________ - The deployment of the Nutri-Score in Europe
____________________________________________________________________ - Responses to some false information circulating about the Nutri-Score
8.1. Nutri-Score would penalize traditional foods, particularly AOP/IGP products that would be “good” products?
8.2. Nutri-Score would penalize the Mediterranean diet?
8.3. Nutri-Score would be stigmatizing, guilt-inducing, infantilizing, anxiety-provoking?
8.4. Nutri-Score would be an infringement of individual freedoms?
8.5. Nutri-Score has no scientific basis; proof that it has already changed its calculation algorithm…
____________________________________________________________________ - The update of the Nutri-Score
9.1. Why the update of the Nutri-Score and how it was carried out.
9.2. What changes for the algorithm?
9.3. Impact on the classification of foods
9.3.1. Impact on sweetened breakfast cereals
9.3.2. Impact on prepared meals
9.3.3. Impact on cereal products
9.3.4. Impact on dried fruits and nuts
9.3.5. Impact on added fats
9.3.6. Impact on cheeses
9.3.7. Impact on meats
9.3.8. Impact on fish products
9.3.9. Impact on beverages
9.3.10. Impact on cocoa powders
9.4. General impact on ultra-processed foods
____________________________________________________________________ - Conclusion
____________________________________________________________________
References
Introduction
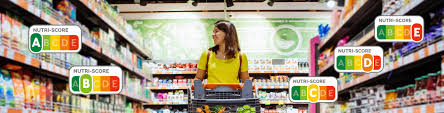
The Nutri-Score is an interpretive, synthetic, color-coded nutrition label that characterizes the overall nutritional quality of foods based on a profiling system that takes into account their nutritional composition. Proposed in 2014 by independent academic researchers specializing in Nutrition and Public Health, validated by the French High Council of Public Health (HCSP) and the French Agency for Food, Environmental and Occupational Health & Safety (ANSES), and coordinated by the National Public Health Agency Santé Publique France, the Nutri-Score was officially recognized on October 31, 2017 by an interministerial decree signed jointly by the Ministers of Health, Agriculture, and Economy and Finance as the recommended front-of-pack nutrition labeling system in France (1).
The decision to implement the Nutri-Score responded (and still responds) to several public health objectives:
- to allow consumers, at a glance, to assess the nutritional quality of foods at the time of purchase and, if they wish, to guide their choices toward foods with more favorable compositions for health,
- to encourage food manufacturers to improve the nutritional composition of their products through reformulation and innovation.
The signing of the interministerial decree in 2017 marked the end of a four-year battle (2) during which scientific evidence demonstrating the effectiveness and superiority of the Nutri-Score over other graphic formats, combined with the support of health professionals, researchers, consumers, and patient groups, ultimately overcame the strategies of powerful agri-food lobbies that had attempted to block or delay its implementation in France.
This article reviews the public health reasons for introducing the Nutri-Score, the scientific basis on which it relies, and the studies validating its usefulness and effectiveness. It also discusses what the label can (and cannot) deliver, addresses circulating fake news, describes its deployment in France and Europe, and presents its recent update.
1. Public health arguments justifying the implementation of the Nutri-Score
1.1. The burden of major nutrition-related public health issues
For many years, it has been well established that consuming a diet that deviates from nutritional recommendations issued by health authorities is a major determinant of risk for chronic diseases. Today, these conditions represent the leading public health challenges facing France, as well as many other countries worldwide: obesity, cardiovascular diseases, cancer, diabetes, and more (3).
The burden of these diet-related chronic diseases is considerable: in 2021, cancers affected 3.4 million people covered by national health insurance; cardiovascular diseases affected 5.3 million people; diabetes 4.1 million; 17% of French adults were obese, and one-third overweight. Among children, 4% were obese and 17.5% overweight. These diet-related diseases have become a leading cause of death, responsible for 80% of premature mortality from non-communicable diseases (4).
Beyond the human toll, these chronic diseases carry immense social and economic costs. The Food and Agriculture Organization of the United Nations (FAO) estimated the hidden costs of the French food system at around €177.5 billion, including €134.3 billion linked to the burden of diet-related chronic diseases (5). The social cost of overweight and obesity alone was estimated at around €20 billion (1% of GDP) in 2012—comparable to the costs attributed to alcohol and tobacco.
While these chronic diseases are multifactorial—driven by genetic, biological, environmental, and behavioral factors—nutrition is a key determinant that is both modifiable and therefore a powerful lever for action at both individual and collective levels within public health policies (6).
1.2. The importance of providing consumers with understandable information on the nutritional quality of foods to combat diet-related chronic diseases
To address the burden of diet-related chronic diseases, most European countries have implemented public health nutrition policies in recent years. In France, the National Nutrition and Health Program (PNNS), launched in 2001, aims to improve diet, physical activity, and the nutritional status of the population (7). Like similar programs across Europe, it is based on broad science-backed dietary recommendations (food-based dietary guidelines) : eat more fruits and vegetables, legumes, and whole foods rich in fiber; increase fish consumption; and limit foods high in sugar, saturated fat, and salt… (8).
However, the reality of the food supply in France (and across Europe) is that a large share of products are industrially processed. In supermarkets, faced with the vast variety of packaged products, consumers find it difficult to translate general public health recommendations into concrete purchasing choices. It is particularly challenging for them to evaluate differences in nutritional composition between available processed foods often placed on the same supermarket shelves, and identify those with better or worse nutritional quality.
Before the introduction of the Nutri-Score, the only nutritional information available to consumers was the mandatory nutrition facts table displayed on the back of packages. However, this table, consisting exclusively of figures, is difficult to read and complex to interpret, with multiple rows and columns giving nutritional values per 100g, per serving, and as a percentage of the recommended daily intake for an average adult consuming 2000 Kcal/day. Studies consistently showed that consumers rarely used it (9).
This is why researchers developed the idea of translating this complex information into a simple, color-coded label placed on the front of food packaging, easy for all consumers to see at a glance, while retaining the detailed nutrition table on the back for manufacturers’ accountability and for people with specific dietary needs (e.g., low-salt diets).
2. How the Nutri-Score is calculated: an algorithm based on solid scientific evidence
The Nutri-Score (initially called the “5-color label” or 5C) is a graded, color-coded label coupled with letters, dividing foods into 5 nutritional quality classes, ranging from green (A) to dark orange (E). It relies on the calculation of a scientifically validated algorithm developed on public health basis.

The 5 nutritional quality classes of the Nutri-Score
The underlying algorithm of the Nutri-Score originated in the UK in the early 2000s, created by an academic research team at Oxford University. It was initially designed to regulate advertising targeted at children and adopted by the British Food Standards Agency (FSA) and the Office of Communications (Ofcom) (10). The original binary version (classifying foods as eligible or not for children’s TV advertising) was later adapted into a 5-class nutrition label by researchers of the French Nutritional Epidemiology Research Team (EREN, Université Sorbonne Paris Nord) in 2012.
The label and its algorithm were officially proposed in a 2014 report to the French Ministry of Health (11) by Professor Serge Hercberg, then President of the PNNS and Director of EREN. In 2016, the algorithm was finalized by the French High Council for Public Health (HCSP) (12) and ANSES (13), while the definitive graphic format was defined after testing by Santé Publique France.
In 2023, the algorithm was updated by a European Expert Committee to incorporate new scientific knowledge, changes in the food market (emergence of new products, reformulations), and corrections of previously identified imperfections (14) (see details in chapter 9).
2.1. Choice of nutrients and nutritional elements considered in the algorithm underlying the Nutri-Score
The initial scientific work carried out by the Oxford scientific team made it possible to identify nutrients and nutritional elements whose consumption should be limited or, on the contrary, promoted given their demonstrated impact in the risk (or protection) of chronic diseases. A rigorous process integrating numerous studies made it possible to justify the elements retained in the algorithm and, through sensitivity studies, to limit their number and notably to avoid redundancies. For example, the inclusion of fruits and vegetables in the calculation proved to be a good proxy for the content of the food in certain vitamins, such as vitamin C and provitamin A (beta-carotene) (15,16). Similarly, proteins appeared as a good proxy for their mineral and trace element content such as calcium and iron.
Thus, the Nutri-Score indirectly captures more nutritional information than the few elements explicitly used in the formula. Unlike many other systems, the Nutri-Score (as HSR) includes both unfavorable elements (energy, sugars, saturated fat, sodium) and favorable elements (fruits/vegetables/legumes, fibers, proteins).
However, for practical reasons, the algorithm cannot include all nutrients of interest (vitamins, minerals, polyphenols, free sugars, fatty acid types), because these data are not part of the nutritional declaration made mandatory by European regulations (INCO regulation, 2011, (17)). They are therefore not included in the nutritional table present on the back of the packaging, which prevents the ability to integrate them into the development of any nutritional table (which is also the case for all existing nutrition labels in the world).
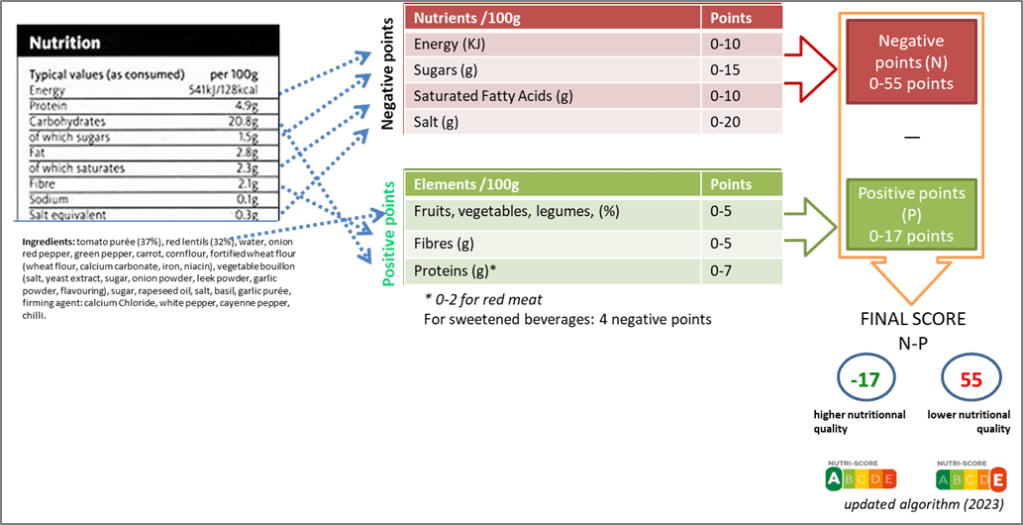
2.2. Allocation of positive and negative points in the calculation of the Nutri-Score
The score is calculated per 100g (or 100ml) of product using values from the mandatory ack-of-pack nutrition table.
- Unfavorable components:
- Energy (0–10 points)
- Saturated fatty acids (0–10 points)
- Total sugars (0–15 points)
- Salt (0–20 points)
- Favorable components:
- Fiber (0–5 points)
- Fruits/vegetables/legumes/nuts (0–5 points)
- Proteins (0–7 points)
The final score is the sum of positive (unfavorable) and negative (favorable) points, ranging from –17 to +55. The score allows, thanks to 4 predefined thresholds (on scientific bases), to classify the foods into 5 classes allowing to assign the 5 colors of the Nutri-Score. The coupling to letters (A/B/C/D/E) ensures greater readability.
Calculation of the Nutri-Score (updated in 2023)
The choice of basing the Nutri-Score algorithm on composition data already available and accessible to consumers allows full transparency and the possibility for everyone to verify the correct attribution of the color/letter of the Nutri-Score. Thus, consumer associations can act as an independent third party verifying the accuracy of data.
Note that the relative weight given to negative elements that count up to 55 points for the calculation of the final score compared to positive elements that only count up to 17 points allows for both a relevant overall evaluation of the nutritional quality of foods all by avoiding ranking too well those who do not deserve it. This ensures that foods with very high levels of sugar, fat, or salt cannot achieve a good score simply by adding fiber or protein.
2.3. A universal calculation method for all foods (with a few exceptions)
The same algorithm applies to all foods, making it a universal system for all food categories. However, specific adjustments were introduced for beverages, cheeses, and added fats and nuts, with the aim of highlighting the variability in nutritional quality within these three food groups and ensuring good consistency with public health nutritional recommendations.
Indeed, for cheeses, without adapting the universal algorithm, all varieties end up classified in the same category (Nutri-Score E). This is not useful for informing consumers about the nutritional composition differences among cheeses, knowing that some are somewhat lower in fat and/or salt than others. The slight modification of the initially planned calculation, updated in the 2023 algorithm revision (which systematically considers protein content, a good proxy for calcium), allows for a more varied distribution of cheeses, covering three Nutri-Score color categories and appropriately distinguishing the nutritional quality differences among cheeses. This is nutritionally coherent, as the use of the specific calculation does not reposition cheeses relative to other dairy products: even distributed across 3 Nutri-Score classes (C, D, and E), they generally fall into less favorable colors/letters compared to other alternatives within dairy products. Therefore, the use of the specific calculation mode, which takes proteins into account, represents a good compromise to better consider the nutritional quality differences of these products, while maintaining the overall coherence of the system with respect to other food products, particularly other dairy products.
In the same way, with the universal calculation method, nuts tended not to be sufficiently differentiated based on their sugar and salt content (not allowing for a separation between raw products and salty snack products or sweet, chocolate-coated forms…). After a slight adjustment to the algorithm, raw nuts are mainly classified in categories A and B, whereas products with significant amounts of sugar or salt are found in categories D and E of the Nutri-Score.
Adjustments have also been applied to added fats, leading to slight modifications in the calculation method to allow for differentiation within vegetable oils based on significant differences in nutritional qualities: for example, olive, canola, and walnut oils are better classified than other vegetable oils, which are distributed across different Nutri-Score classes based on their saturated fatty acid content.
Finally, for sugary beverages, the adaptation of the calculation method (more penalizing for sugar, and considering the presence of sweeteners since its recent update) allows for discrimination between water (the only beverage classified as A) and other beverages categorized from B to E based on their sugar content, or from C to E if sweeteners are present alone or with sugar.
These adjustments improve the label’s alignment with public health nutrition recommendations.
3. How the Nutri-Score helps consumers compare the overall nutritional quality of foods at the time of purchase
3.1. Purpose of the Nutri-Score
The purpose of the Nutri-Score is not to divide foods into “healthy” and “unhealthy” in absolute terms. Such a binary classification would be misleading, because the health impact of a food depends on quantity, frequency of consumption, and the overall balance of the diet (that does not depend on the consumption of a single food item, nor on a meal or even a day…). These complex notions cannot, of course, be summarized by a single nutritional label assigned to a specific food product of a given brand.
Moreover, food health value is not limited to nutrient composition. Other factors matter, such as processing level (especially ultra-processing), additives, pesticide residues, packaging contaminants, and compounds formed during processing (see chapter 5.1.). Beyond health, foods also raise environmental, social, and ethical issues (e.g., animal welfare, fair remuneration of farmers). All these dimensions are undoubtedly important, but they cannot be addressed by a single nutritional label that strictly summarizes the nutritional composition. This is already significant, as studies have shown that simply consuming foods well-ranked in terms of nutritional composition by the Nutri-Score was associated with a lower risk of chronic diseases (see chapter 4.1.3).
Thus, Nutri-Score’s role is to give consumers a relative comparison tool: at a glance, they can compare foods’ nutritional quality and, if they wish, choose healthier alternatives or at least be able to integrate the nutritional dimension with other factors that influence their purchasing decisions, such as attachment to taste or brand, price, and the attractiveness of packaging…
But of course, the comparison between the nutritional qualities of different foods is only meaningful if it is relevant, particularly if it pertains to foods that the consumer is likely to compare in real life, at the time of their purchase or consumption.
3.2. Practical use of the Nutri-Score
The Nutri-Score is designed to help consumers quickly compare the nutritional quality of different foods in shopping situations within the same category or for the same food across different brands. These are, in practice, the most common situations that consumers encounter at the time of their purchases. However, the Nutri-Score is also useful for comparing foods from different categories that serve the same purpose and can be substituted in terms of use or consumption. Below are a few illustrations:
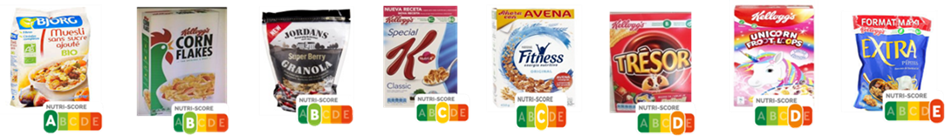
3.2.1. The Nutri-Score allows for comparing differences in nutritional quality among foods belonging to the same category.
For example, within the breakfast cereals category, one can compare mueslis or granolas versus chocolate cereals, versus chocolate-filled cereals… (with Nutri-Scores ranging from A to E).
Comparison within the breakfast cereals category:
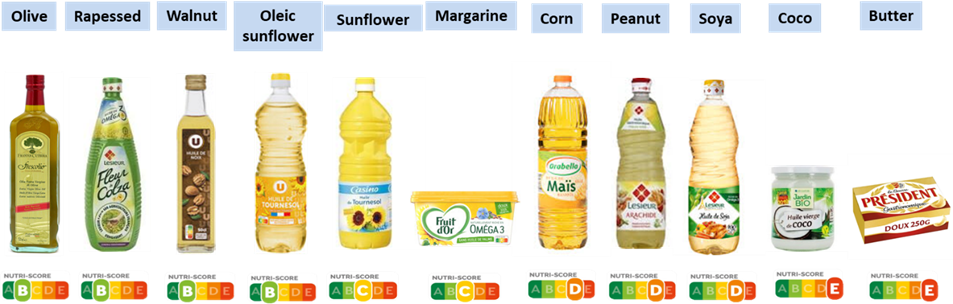
Within the category of added fats, recognizing the differences in nutritional quality among olive, canola, walnut, sunflower, peanut, coconut, and palm oils, as well as margarines and butter (ranging from B to E).
Comparison within the category of added fats:
Or, within ready-made dishes, comparing the differences in nutritional quality of meat lasagna with those made with salmon, tuna, spinach, vegetables, or many other ready-made dishes based on pasta or other ingredients (with variations in nutritional quality ranging from A to E). For example, the Nutri-Score allows for recognizing the nutritional quality differences among the many types of pizzas or savory tarts (which can vary from B to E):
Comparison within the category of pizzas and savory tarts:

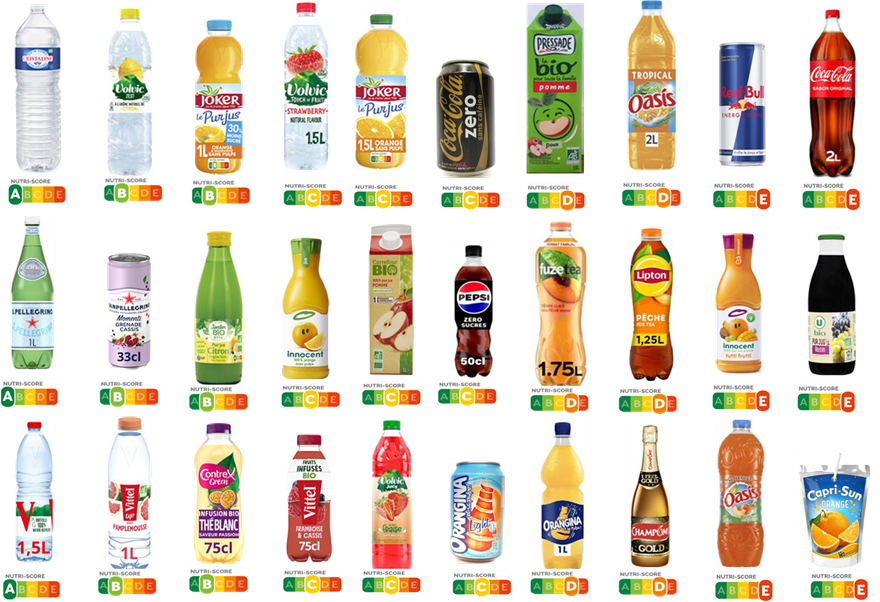
Another example: within the beverage category (plain or flavored water, fruit juices, fruit-based beverages, sodas, dairy-based drinks, plant-based drinks, etc.), being able to easily assess the differences in nutritional quality (with Nutri-Scores ranging from A to E based on sugar content and/or the presence of sweeteners).
Comparison within the beverage category:
In each category, there are several Nutri-Score classes, which provides useful information for consumers’ choices.
3.2.2. The Nutri-Score also allows for comparing differences in nutritional quality for the same food offered by different brands.
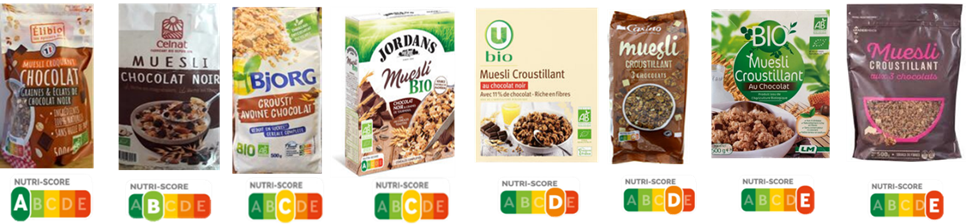
For example, comparing chocolate mueslis from one brand with its “equivalent” from another brand bearing the same name.
Comparison of different products named Chocolate Muesli:
Or comparing “cordon bleu” escalopes or cassoulets offered by different brands but with the same designation.
Once again, differences in nutritional quality for products with exactly the same name, and therefore often not obvious, can be easily highlighted thanks to the Nutri-Score.
3.2.3. The Nutri-Score also allows for comparing differences in nutritional quality among foods belonging to different categories but having the same usage conditions, purposes, or intended consumption (and which are often located in the same supermarket aisles or nearby sections).
This is notably the case for foods that are typically consumed at the same time, for the same occasion of eating, or that are used for the same purpose and therefore may compete and substitute for each other at the time of food purchasing decisions. For example, this applies to foods that can be consumed as an appetizer/starter: the consumer may need to choose between foods in the category of raw vegetables or others in the category of charcuterie, spreadable salted products, or soups/broths. Similarly, for various foods that can be consumed during an aperitif: savory snacks, raw vegetables, spreads, dried fruits, or canapés.
Comparison of different foods from various categories that can be consumed during an aperitif *,**

*As mentioned earlier, there is also variability in nutritional quality within each of the categories of foods typically consumed at an aperitif: for instance, while the Nutri-Score allows for comparing chips to dried fruits or charcuterie, the label also highlights differences in nutritional quality within the chips, which can vary in composition from B to D (depending on their salt and fat content); for dried fruits, it can vary from A (for natural forms) to E (for salted forms); and for spreads, it can range from B to D depending on the types.
**If today only certain pre-packaged raw vegetables (notably tomatoes) display the Nutri-Score, it’s important to keep in mind that with its planned expansion in 2025 to raw products (see chapter 6.5), all fruits and vegetables sold loose will be able to display the Nutri-Score.
The same reasoning applies for comparing foods consumed for dessert: between the categories of fruits, dessert creams, yogurts, pastries, or ice creams and sorbets.
Similarly, for foods purchased to be consumed at breakfast, where the consumer may be prompted to choose between breads, toasts, breakfast cereals, biscuits, and industrial pastries.
The Nutri-Score of foods from different categories consumed at breakfast:

Therefore, the Nutri-Score indeed allows for comparing the nutritional qualities of foods from different categories, as long as the comparison is relevant. This is, in fact, what consumers intuitively do during their shopping. For example, when grocery shopping, they do not question whether they should choose between breakfast cereals and olive oil or between sardines and soda. It is highly unlikely that a consumer would consider having a bowl of olive oil for breakfast, using breakfast cereals to season their salad, or quenching their thirst with canned sardines…
If the use of the Nutri-Score by consumers is intuitive within and between categories for foods with the same usage, its calculation method, as mentioned in chapter 2.3, is universal, meaning it is the same for all foods. The calculation is therefore not done by category (with the three exceptions noted earlier: beverages, cheeses, and added fats/nuts). This means that within a product category, it is logical that we do not always find all five Nutri-Score classes. In some categories, there are not systematically A or B products, or E or D products. Analyses of the distribution of available food offerings in France (and in many European countries) have shown that the Nutri-Score objectively reflects the variability of nutritional composition within the same food category, often representing at least three Nutri-Score classes, which allows for a legitimate discrimination of nutritional quality differences, thus providing consumers with useful information: to aim for the best-rated products compared to other “equivalent” products in terms of usage.
For example, in the category of added fats, none are classified as A. However, those with the most favorable nutritional composition, like olive oil or canola oil (which are recommended to be prioritized among oils), are classified as B (the best possible score for this type of food), while other oils are classified from C to E, and butter is also classified as E. Thus, the Nutri-Score easily shows which oils should be prioritized in the added fats category.
It is interesting to note that scientific analyses of major food composition databases (see chapter 4.1.1.) reveal that the classification of foods by the Nutri-Score is generally consistent with public health nutritional recommendations regarding the main food groups: the food groups that are promoted (e.g., fruits and vegetables) are better rated than those whose consumption is recommended to be limited (e.g., sugary, fatty, and/or salty products). However, since there is significant variability in composition within the major food groups, the Nutri-Score provides an objective measure of nutritional composition differences within the food groups that are subject to public health nutritional recommendations. But it is essential not to confuse providing information about the nutritional quality of specific foods with giving nutritional recommendations.
3.3. The Nutri-Score provides information at the food level; it does not replace general public health nutritional recommendations but complements them.
Public health nutritional recommendations (such as those from the PNNS in France) provide information on the consumption of large food groups (fruits and vegetables, dairy products, meats, fish, added fats, sugary products, etc.) with the aim of helping consumers move toward a healthy diet. This information covers the quantities and/or frequencies of consumption for these various generic food groups and helps to structure the diet. However, within these major groups, the specific foods that constitute them exhibit a great variability in composition, particularly when considering the range of industrial foods.
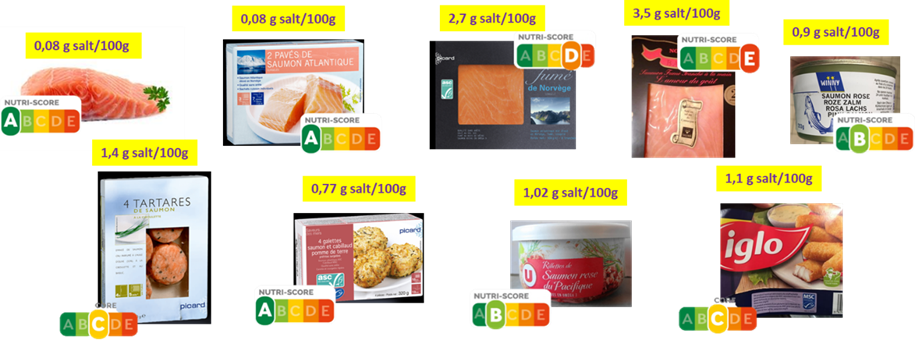
For example, in the case of fish, it is recommended to consume it twice a week (including one fatty fish). However, fish are sold in various forms (fresh, canned, smoked, tartare, patties, breaded) that do not have the same nutritional composition. Fresh salmon (like other fatty fish) contains no salt (thus classified as A by the Nutri-Score). It contains 1 g/100 g if canned, giving it a Nutri-Score of B. On the other hand, it contains between 3 to 4 g/100 g if smoked, corresponding to 2/3 to 3/4 of the 5 g of salt/day recommended not to exceed according to nutritional guidelines. It is therefore legitimate that smoked salmon is classified as Nutri-Score D or even E, which serves to alert consumers to the fact that its consumption among fish should be reasonable in quantity and frequency to avoid excessive salt intake and to adhere to another important recommendation, which is to limit daily salt intake due to its cardiovascular impacts, particularly hypertension demonstrated in high salt consumers. While it is entirely possible to consume smoked salmon as part of a balanced diet (but in small quantities and not too frequently), there are alternatives to salmon, in natural form (and to a lesser extent in canned form), that offer all the benefits of fish without the drawbacks of high salt intake.
4. A Public Health Tool Validated by Numerous Solid Scientific Studies
To choose an effective nutritional label within a public health nutrition policy, it is essential that it is built on robust scientific foundations and that its usefulness and effectiveness are validated by scientific work. In practice, to assess the actual quality of a nutritional label intended to be displayed on the front of food packaging, it is necessary to demonstrate both the relevance of the algorithm on which its calculation is based and the performance of its graphic format. A conceptual framework (18,19) and a detailed methodological process published by the WHO (20-22) describe the necessary validation studies to select an effective nutritional label in terms of public health. It is important to note that the Nutri-Score has followed all the recommended steps: numerous studies have validated both its calculation algorithm and its graphic format.
4.1. Validation of the algorithm: the nutritional profiling system underlying the Nutri-Score
4.1.1. The algorithm’s ability to correctly classify foods
Various studies analyzing generic food composition tables from different European countries —France, Spain, Belgium, Italy, Finland, Norway, the Netherlands, Portugal, Slovakia, Sweden (24,25 )—have shown that the Nutri-Score classification is consistent with public health nutritional recommendations: the majority of products containing primarily fruits and vegetables are classified as A or B, while most sweet and savory snack products, sauces, and animal fats are classified as D or E. Consistency has also been confirmed within specific food groups: within the starch group, legumes, pasta, and rice are generally rated higher than breakfast cereals. In the dairy products group, milk and yogurt are rated higher than cheeses. Composite dishes are widely distributed across the different Nutri-Score classes, objectively reflecting the variability of products within this specific category. Significant variability has been observed across all food groups, as foods in each category have been systematically distributed across at least three Nutri-Score classes, which is a useful element to help consumers differentiate nutritional qualities among foods. This within-group discrimination helps consumers identify healthier alternatives.

A specific study conducted in 2023 in Portugal (26) examined the ability of the Nutri-Score to differentiate the nutritional quality of foods consumed by the Portuguese population and its consistency with Portuguese nutritional recommendations. At least three Nutri-Score categories (colors/letters) were observed for most food groups, and a minimum of two categories were identified for sub-groups. The classification of foods according to the Nutri-Score appears to align with portuguese nutritional recommendations. Food groups whose consumption is encouraged are rated more favorably than those for which consumption should be limited.
4.1.2. Validation of the Nutri-Score calculation algorithm in relation to food consumption, nutrient intakes, and nutritional status biomarkers
Various epidemiological studies involving thousands of participants (27-30) have shown that individuals with a dietary intake profile corresponding to a better Nutri-Score consume higher amounts of fruits, vegetables, and fish, and lower amounts of sugary, fatty, and salty snacks. They also have higher intakes of fiber, vitamin C, beta-carotene, calcium, zinc, and iron, lower intakes of saturated fatty acids, and better adherence to public health nutritional recommendations. Additionally, they exhibit more favorable antioxidant biological profiles with higher blood levels of vitamin C and beta-carotene (28).
Overall, studies demonstrate that the consumption of foods rated higher on the Nutri-Score scale is associated with better overall dietary quality and improved nutritional status among individuals. Results in the same direction have been found in a recent study testing the revised Nutri-Score algorithm updated in 2023 (to be implemented in France in 2025), which is also correlated with food consumption, nutritional intakes, and various markers of nutritional status (31).
4.1.3. Prospective association of the Nutri-Score calculation algorithm at the individual level with health criteria
The most convincing argument for assessing the value of a nutritional label is the demonstration, within the framework of prospective cohorts, of its association with individual health criteria. The Nutri-Score algorithm has been studied in large cohorts in France, Italy, Spain, and Europe.
In France, analyses in the SU.VI.MAX study (6,435 participants followed for 13 years) (32-35) as well as in the NutriNet-Santé cohort (46,864 participants followed for 6 years) (36,37) demonstrated that the consumption of foods rated higher on the Nutri-Score scale was prospectively associated with a lower risk of developing cancers, cardiovascular diseases, metabolic syndrome, and less weight gain.
In Spain, the SUN cohort (20,503 participants; 10 years of follow-up) (38) and the ENRICA cohort (12,054 adults followed for 10 years) (39) also showed that the consumption of foods with a poorer Nutri-Score was prospectively associated with a higher overall mortality rate and mortality from cancer and cardiovascular diseases.
Similar results have been found in Italy within the MOLI-SANI cohort (22,895 subjects; 12.2 years of follow-up) (40), showing an increase in overall mortality and cardiovascular mortality among individuals consuming foods rated lower on the Nutri-Score scale.
Three studies have also been conducted within the EPIC (European Prospective Investigation on Cancer and Nutrition) cohort, covering 10 European countries and involving 521,000 participants followed for over 15 years. The first study (41), during which 49,794 cancers were diagnosed, revealed that the consumption of foods rated lower on the Nutri-Score scale was associated with an increased risk of developing cancer, particularly in the gastrointestinal tract, lung cancer in men, liver cancer, and breast cancer in women. In the second EPIC cohort study (42), 53,112 deaths occurred over more than 17 years of follow-up, and the consumption of foods with a less favorable Nutri-Score was associated with higher mortality rates from all causes, as well as from cancer and cardiovascular diseases. Another study involving over 340,000 people from the EPIC cohort followed for 12 years in 7 European countries also confirmed that the consumption of foods rated lower on the Nutri-Score scale (especially with its updated version) was associated with an increased risk of cardiovascular diseases (43).

Additionally, a case-control study conducted in Italy involving 2,419 colorectal cancer cases and 4,723 controls showed a higher risk of colorectal cancer among individuals consuming foods with a less favorable Nutri-Score (using the revised 2023 version) compared to those consuming better-rated foods (4th quartile vs. 1st quartile) (44).
Within the NutriNet-Santé cohort, an analysis of over 71,000 participants followed for 9 years showed that regular consumption of foods rated lower by the nutritional profiling system used to calculate the Nutri-Score was associated with greater weight gain and an increased risk of overweight and obesity (45).
In a similar vein, a prospective Spanish cohort (628 individuals aged ≥60 followed for 6 years) showed that the consumption of foods rated lower on the Nutri-Score scale was associated with a higher risk of abdominal obesity. In Germany, a cross-sectional study involving 1,460 subjects also found a relationship between the score underlying the Nutri-Score and type 2 diabetes (47).
In an Irish study of 2,006 subjects, an association was observed between the score underlying the Nutri-Score and lipoprotein subclass profile, which could be a potential underlying mechanism for the favorable effects of the Nutri-Score found in prospective cohorts concerning cardiovascular disease risk (48).
Other analyses conducted within various cohorts have also found links between the score underlying the Nutri-Score and the risk of Crohn’s disease (49) and asthma (50), as well as a decline in renal function (51).
Ultimately, all prospective cohort studies conducted in different contexts have systematically found an association between the consumption of foods with a favorable Nutri-Score and a lower risk of chronic diseases, as well as a reduction in mortality. These results highlight the individual benefit of striving to consume foods that are better rated on the Nutri-Score scale. They also allow to conclude that while each of the nutritional elements considered in the calculation of the Nutri-Score has a solid scientific justification, the aggregation of these components within the overall algorithm is strongly validated. They confirm the relevance and reliability of the algorithm concerning the different constituent elements considered and the calculation method.
4.2. Validation of the graphic format of the Nutri-Score
Many studies have evaluated the effectiveness of the graphic format of the Nutri-Score (and its initial version, the “5C or 5 colors” label) at the consumer level, particularly in comparison to other existing labels.
4.2.1. Perception, attractiveness, and preferences
The results of scientific studies involving large populations (thousands or tens of thousands of subjects) (52-54) and consumer surveys conducted in France (55), Spain (56), Belgium (57), and Germany (58) have consistently demonstrated the superiority of the Nutri-Score compared to other tested nutritional labels in terms of perception, ease of identification, and speed of interpretation. All studies highlight that the Nutri-Score is favorably perceived by consumers and is seen as the preferred format compared to other nutritional labels, particularly by less advantaged populations.
However, it is not enough for a graphic format to be well perceived, appreciated, and preferred by the population (subjective understanding), it is essential to demonstrate that it effectively influences purchasing choices and thus the food intake of consumers. For this reason, it is crucial to show that the graphic format is well understood by consumers. Indeed, subjective understanding does not guarantee that the label actually helps in making the right nutritional choices. A label may be appreciated by consumers or even preferred over another without necessarily leading to better choices. Hence, the importance of testing its objective understanding in population studies.
4.2.2. Objective understanding and impact on purchasing intentions
Studies on the objective understanding of a label allow for the evaluation of its ability to genuinely help consumers correctly classify foods based on their nutritional quality (which differs from studies on subjective understanding that only test declared preferences by consumers).
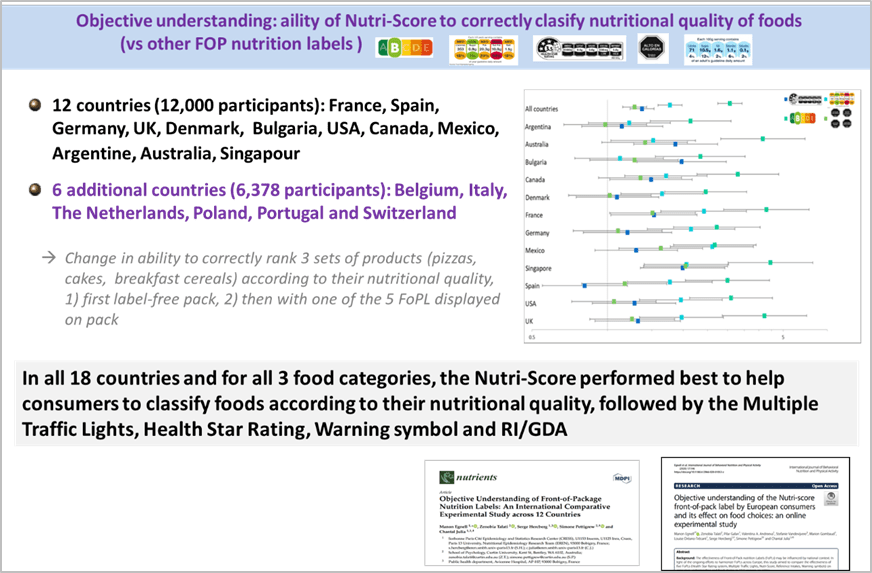
The Nutri-Score has been the subject of in-depth studies on objective understanding, particularly in 12 European countries involving over 12,000 subjects (59), and in six countries across North America, Latin America, Asia, and Oceania involving over 6,000 subjects (60). These studies have shown that the Nutri-Score is the most effective compared to other nutritional labels – the British Multiple Traffic Light (MTL), Chilean health warning systems, Australian Health Star Ratings (HSR), and GDA/RIs supported by food companies – in improving consumers’ ability to correctly classify foods based on their nutritional value, regardless of their sociodemographic category.
It is important to note that a study conducted in France with over 14,000 participants (61) showed that the probability of correctly classifying products using the Nutri-Score, compared to a control situation without label, was particularly high among subjects from disadvantaged socio-economic backgrounds and those with lower nutritional knowledge.
In Great Britain, a study conducted on a representative sample of 4,404 participants comparing four nutritional labels (MTL, Nutri-Score, Chilean Warnings, and Positive Choice tick) and a control group without a label revealed that while all tested labels were effective in improving participants’ ability to correctly classify products based on their nutritional quality, the greatest effectiveness was observed for the Nutri-Score (62).
Similarly, a study conducted in Morocco (63) compared four nutritional labels (HSR, Warnings, GDAs, and MTL) and their impact on the purchasing intentions of 814 participants. Three categories of foods were tested (yogurts, biscuits, and cold cuts). The Nutri-Score was associated with the strongest improvement in the ability to correctly classify foods based on their nutritional quality. Regarding the perception of nutritional labels, the Nutri-Score received the most positive responses for ease of recognition, understanding, and providing quick information. The Nutri-Score was ranked as the preferred label by Moroccan participants.
Another online study conducted in Greece with 1,278 participants (64) studied the objective understanding and perceptions of Greek consumers in response to five nutritional labels: MTL, HSR, GDAs, Warnings, and the Nutri-Score. The results showed that the Nutri-Score is the label with the best performance in helping Greek consumers classify foods based on their nutritional value. A post hoc analysis of the data from this study on 510 participants (65) confirmed that the Nutri-Score was the most understandable, clearest, most visible, and preferred label compared to GDAs, which require more time to be understood.
In an other study involving 1,389 Greek adults (66), while participants reported that multiple traffic lights (MTL) were their preferred label, the average score for objective understanding (reflecting a label’s ability to help consumers correctly classify foods based on their nutritional quality) was highest for the Nutri-Score, meaning it was the most effective labels compared to the other tested labels, NutrInform Battery and MTL. This study confirms that just because consumers prefer a nutritional label does not mean it is useful in guiding their choices toward healthier food purchases. Therefore, the selection of a nutritional label by health authorities should primarily rely on its effectiveness rather than its preference.
In a similar vein, a recent study conducted in Saudi Arabia (67) compared the influence of five nutritional labels (Health Star Rating, Guideline Daily Amount/GDA, Multiple Traffic Lights, Chilean Health Warnings, and the Nutri-Score) on the objective understanding and food choices of 2,509 Saudi consumers. In the group exposed to the Nutri-Score, a significant improvement in food choices was observed across all food categories compared to GDAs. All nutritional labels led to a higher proportion of correct responses in the classification of the nutritional quality of foods compared to the no-label condition. However, it was the Nutri-Score that showed the best performance regarding the understanding of the nutritional quality of foods, significantly improving participants’ ability to correctly classify products across all food categories.
There are a few studies, all conducted by Italian authors (68-70), suggesting a better understanding of NutrInform, a label endorsed by the Italian government and the Italian Federation of Food Industries, compared to the Nutri-Score. NutrInform is a monochrome label that provides nutrient information, based on principles and graphical representations very similar to the GDAs/RI established by the food industry in the 2000s. It is worth noting that these studies focus on subjective understanding (not objective understanding) and have been funded by the Italian food industry, which opposes the Nutri-Score. This last point is significant, as evidenced by a scientific publication from 2024 (71) showing that a study is 21 times more likely to find unfavorable results for the Nutri-Score if the authors declare a financial conflict of interest or if the study has been funded by industry players. This study identified three private entities particularly involved in funding (or conflicts of interest of the authors) of studies unfavorable to the Nutri-Score: Federalimentare (the Italian Federation of Food Industries), the Italian Nutrition Foundation (supported by 18 Italian food manufacturers), and the Dutch Dairy Association.
Three randomized controlled trials (not funded by industry) have compared the performance (objective understanding, purchase intentions) and preferences (subjective understanding, appreciation, comparative preference) of the Nutri-Score compared to NutrInform among consumers from Portugal (72), Spain (73), and Italy (74). Three categories of foods were tested: breakfast products (8 products), breakfast cereals (7 products), and added fats (8 products). Regarding the objective understanding of the labels, the Nutri-Score outperformed NutrInform in all three studied countries and in all three tested food categories. Regarding purchase intentions, the Nutri-Score leads to nutritionally more favorable choices compared to NutrInform. Moreover, it is interesting to note that the choice of olive oil (rich in monounsaturated fatty acids) is encouraged by the Nutri-Score, whereas NutrInform promotes the selection of oils lower in saturated fatty acids (notably sunflower and canola oil). Consumers from all three countries found the Nutri-Score easier to use than NutrInform.

Additionally, an online survey conducted in Belgium (75) evaluated the perception and objective understanding of three nutritional labels (the Nutri-Score, GDAs, and British Multiple Traffic Lights) among 2,295 students with varying levels of health literacy. In terms of objective understanding, the Nutri-Score surpassed all other nutritional labels at all levels of literacy. The results confirmed that the Nutri-Score was particularly effective in guiding students in their food choices and represented a particularly useful strategy for disadvantaged individuals with limited health literacy.
4.2.3. Impact on purchasing intentions and the nutritional quality of food purchases
Ultimately, the most relevant studies for asserting the effectiveness of the graphic formats of nutritional labels are those that demonstrate their impact on the nutritional quality of foods actually purchased by consumers. Several studies have tested the effect of the Nutri-Score compared to the absence of labels or to other labels on consumer choices regarding the nutritional composition of shopping baskets: four studies were conducted in virtual supermarkets (measuring purchase intentions among the general population, students, individuals with chronic diseases, and disadvantaged socio-economic populations) (76-78); two studies were developed in a controlled manner in experimental stores to test the effects of various nutritional labels on actual purchases (79-81); and importantly, a large-scale, “real-life” study was conducted in 60 French supermarkets nationwide (10 displaying the Nutri-Score; 10 using the British Multiple Traffic Light MTL; 10 displaying the SENS label proposed by food distribution; 10 using GDAs/RIs proposed by the food industry; and 20 supermarkets without any label) (82,83). In this study, over 1.7 million receipts were analyzed.
The results of all these studies are consistent and show that the presence of the Nutri-Score improves the overall nutritional quality of shopping baskets, with the Nutri-Score’s performance consistently surpassing that of the other tested labels. These studies revealed that the overall nutritional quality of the shopping basket improved by 4.5% to 9.4% with the use of the Nutri-Score, and the effect of the Nutri-Score was particularly pronounced among underpriviledged participants (from disadvantaged socio-economic backgrounds).

A post-hoc analysis of three randomized controlled trials simulating purchases with the Nutri-Score also found a positive effect of the Nutri-Score on the composition of shopping baskets, with a decrease in purchases of ultra-processed products and a higher proportion of unprocessed and unpackaged foods, aligning better with public health recommandations (84).

A study conducted in Belgium (85) tested the effect of a black-and-white Nutri-Score not displayed on product packaging but on electronic price tags fixed in the supermarket shelves. Therefore, the study did not examine the effect of the Nutri-Score in its official color version, placed directly on the front of the packaging. Under these conditions, there was no effect on consumer purchasing behavior, demonstrating that the Nutri-Score must be displayed on packaging and in its color version.
Another online study published in 2025 (86) also showed that both the Nutri-Score and the Chilean nutritional warning system are effective in guiding consumers’ purchasing intentions in Indonesia, Mexico, and Turkey. The Nutri-Score impacted purchasing intentions for four tested food categories, while the warning label system influenced only one. Overall, the Nutri-Score proved to be slightly more effective in guiding consumers toward healthier choices and products richer in nutrients compared to warning labels, although the effects varied considerably across product categories and nutrients.
A randomized controlled intervention study conducted in a virtual supermarket in Spain (87), testing the impact of the Nutri-Score and the Chilean health warning system, showed no difference between groups in the percentage of fresh and minimally processed products purchased or in their nutritional profile.
Additionally, a randomized trial conducted in Singapore (88) using an online grocery store tested the impact of British Multiple Traffic Lights (MTL) and the Nutri-Score on 154 participants compared to a control group without label. Both labels significantly improved consumer choices evaluated by indices characterizing a healthy diet compared to the control, but neither was statistically superior to the other. Analyses suggest that the Nutri-Score may be preferable if the goal is to improve overall diet quality, while MTLs may be more effective if the aim is to reduce total energy intake.
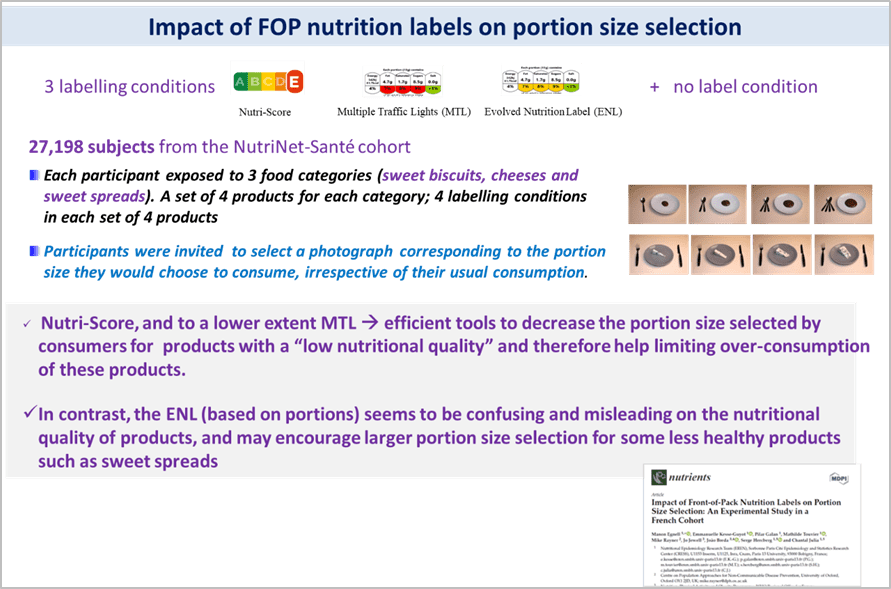
It is also noteworthy that another study on French consumers (89) showed that the Nutri-Score was the most effective nutritional label for reducing the portion sizes chosen by consumers for low-nutritional-quality products, thereby helping to limit the overconsumption of these products.
On the other hand, an online study involving 1,000 subjects in Germany (90) showed that the Nutri-Score can help prevent health halo effects caused by nutritional claims regarding sugar (for example, no added sugar, 30% less sugar…). The authors concluded that making the Nutri-Score mandatory when using nutritional claims could be a possible way to reduce misconceptions about foods with unfavorable compositions for health and to mitigate health halo effects caused by sugar claims.
4.3. Analysis by the Joint Research Centre of the European Commission on the effectiveness of different nutritional labels
On September 10, 2022, the Joint Research Centre (JRC) of the European Commission, an internal scientific service conducting research and providing independent scientific advice based on factual elements to support EU policy-making, published the results of four scientific analyses related to consumer information on food. Regarding front-of-pack nutrition labeling, the 230-page scientific report (91) authored by 13 international scientists from the JRC reviewed 173 articles with a rigorous methodology extensively described in the report.
The scientific work reviewed various characteristics of nutritional labels: consumer attention, preferences and acceptance, understanding, impact on food purchases, the role of socio-economic differences, implementation effects, diet and health, reformulation, and food innovation. The main conclusions from this well-documented scientific work are (beyond general considerations on nutritional labels) that:
- Consumers appreciate the presence of nutritional labels on the front of food packaging, viewing them as an easy and quick way to obtain useful nutritional information at the point of purchase.
- The use of colors makes nutritional labels more prominent and captures consumers’ attention more effectively.
- Less complex nutritional labels require less time and attention to be processed by consumers.
- Most studies suggest that consumers prefer colorful nutritional labels.
- Overall, consumers seem to favor simple, colorful, and directive nutritional labels.
- Studies show that simpler labels, evaluative and using a traffic light color coding system, are easier to understand than more complex, non-evaluative, monochrome labels.
- Consumers prefer labels based on obvious reference quantities that are simple to comprehend, and they understand them better when they require less “mental calculation” to process the information.
- Warning labels like “high in…?” seem more effective than other types in discouraging the purchase of less healthy products. However, other labels (Nutri-Score, simple or multiple traffic lights, and to a lesser extent RI/GDA) appear to work better in improving overall healthier food choices by combining an increase in the purchase of healthy products with a decrease in those that are less healthy.
- In terms of purchasing impact, experimental studies suggest that colorful labels are more useful than monochrome versions for encouraging consumers to buy overall healthier foods.
- Nutritional labels on the front of packaging can guide consumers toward healthier eating.
- Low-income consumers seem to prefer evaluative nutritional labels.
- Nutritional labels intended for front-of-pack application appear capable of prompting food companies to improve the nutritional quality of their products, for instance, by reducing added salt or sugars.
As can be seen from reading these conclusions, the Nutri-Score ticks all the boxes in terms of positive characteristics regarding its utility and effectiveness, rated by the JRC as a simple, colorful, synthetic, and evaluative nutritional label based on a straightforward reference quantity (100g or 100ml).
In contrast, the Italian NutrInform battery system is classified as a monochrome, non-evaluative, and complex label (which, according to JRC analyses, is considered less well positioned in terms of utility and effectiveness).
4.4. The European Commission’s Public consultation on nutritional information systems: the opinions of various stakeholders
A public consultation (92) was launched by the European Commission between December 2021 and March 2022, aimed at gathering the views of EU citizens (and from third countries), as well as professional and non-professional stakeholders, regarding initiatives to revise EU legislation on consumer information about food, particularly front-of-pack nutrition labeling.
The analysis of this consultation indicated that consumer associations, citizens, NGOs, research institutions, and public authorities support, and even advocate for, a nutritional label providing a comprehensive, graded information (which corresponds entirely and exclusively to the characteristics of the Nutri-Score). Unsurprisingly, only economic actors preferred other options.
4.5. Measuring the expected impact of the Nutri-Score and other nutritional labels in terms of chronic disease incidence, mortality, and various socio-demographic indicators
A study (93) using a modeling approach (the British PRIME model) estimated that the overall mortality due to chronic diseases could be reduced by 3.4% through the simple implementation of the Nutri-Score, based on results observed in various published studies evaluating the effects of the Nutri-Score on the nutritional quality of shopping baskets. This effect is greater than that of the other labels studied: HSR, GDA/RIs, MTL, and SENS.

Another study published in 2024 by OECD researchers (94), using robust statistical models, compared the effects of four nutritional labels (Nutri-Score, the Swedish Keyhole, Nutricouleurs corresponding to British Multiple Traffic Lights (MTL), and Nutrirepères corresponding to GDA/RIs). The analyses demonstrated the superiority of the Nutri-Score across all studied criteria.
The results indicate that voluntary adoption of the Nutri-Score across all 27 EU countries could prevent nearly 2 million cases of non-communicable diseases between 2023 and 2050 and significantly reduce annual health expenditures (by about 0.05%).
Moreover, by reducing the risk of chronic diseases, the Nutri-Score has the potential to improve employment and productivity in the EU, outperforming other tested labels, with an annual gain of 10.6 full-time equivalents for every 100,000 working-age individuals. These results come from studies where the Nutri-Score is not generalized to all foods, reflecting the current situation in European countries as the Nutri-Score is applied voluntarily by companies, with some still refusing to display it. The authors conclude that mandatory implementation of the Nutri-Score would yield even more significant public health benefits.

4.6. Impact of displaying the Nutri-Score in advertisements
A randomized controlled trial involving 27,085 participants from the NutriNet-Santé cohort compared a group of subjects exposed to advertisements displaying the Nutri-Score with a group not displaying the Nutri-Score in the same ads (95). The findings showed: a) perceptions of foods were better for those classified as Nutri-Score A or B (indicating favorable nutritional quality), with stronger intentions to purchase and consume them; b) perceptions were, on the contrary, worse for products displaying Nutri-Score D or E (indicating less favorable nutritional quality), with reduced purchase and consumption intentions; and c) there was little to no effect on perceptions and intentions to purchase and consume foods of intermediate nutritional quality (Nutri-Score C).
These results highlight that displaying the Nutri-Score in advertising can genuinely assist consumers in directing their choices toward foods of better nutritional quality, more beneficial to their health.
5. What the Nutri-Score can (or cannot) provide
It should not be expected that the Nutri-Score provides more than what a nutritional label can offer. A nutritional label applied to foods, no matter how well designed, cannot single-handedly resolve all nutrition-related issues. While it focuses solely on providing information about nutritional composition, this is already significant in terms of public health, as evidenced by prospective cohort studies linking the consumption of foods well classified by the Nutri-Score to reduced risks of chronic diseases and lower mortality (voir chapitre 4.1.3.).
However, the limitations of the Nutri-Score are inherent to all nutritional labels. These limitations are well-known and must be accepted, as they do not detract from the Nutri-Score’s health benefits. Yet, these recognized and acknowledged limitations are often leveraged by detractors of the Nutri-Score (and opposing lobbyists) who try to use them to obscure its value and discredit the label as a whole.
What are these limitations?
5.1. The calculation of the Nutri-Score, in its current form, only reflects the nutritional quality of foods and does not include other health dimensions
The Nutri-Score provides information about the nutritional composition of foods, which is the most established dimension regarding health impact. However, it currently does not incorporate other health dimensions of foods such as ultra-processing, the presence of additives, newly formed contaminants from packaging, or pesticide residues. However important these dimensions may be, none are included in any nutritional label worldwide today, as it is currently not possible to account for them in calculating a single indicator and therefore to aggregate them into one label (issues of weighting different dimensions and the need for stronger evidence for some dimensions…). Moreover, it is difficult to expect a label to cover all these different dimensions on its own, as doing so could lead to an average score that becomes meaningless, thereby losing the significance of each component integrated into the overall score and obscuring very different characteristics and qualities for two products sharing the same score.
Even though the dimensions of nutritional quality and ultra-processing overlap—most ultra-processed foods are high in fat, sugar, and/or salt—this overlap is only partial: 87.5% of ultra-processed foods (NOVA 4) are classified as C, D, or E (97). However, a small number of ultra-processed foods may have good nutritional quality (and thus a good Nutri-Score ranking). For example, whole wheat bread, unsweetened fruit compotes, or plant-based burgers can be ultra-processed yet classified as A by the Nutri-Score. Conversely, some foods that are not ultra-processed may not have favorable nutritional compositions. For instance, 100% pure grape juice, a non-ultra-processed food, contains a very high amount of sugar (160g of sugar/liter!) and is therefore classified as E by the Nutri-Score. It is understandable that for a small number of foods, divergences may exist. It must be accepted that nutritional composition and ultra-processing are two complementary dimensions (88). Therefore, additional information should be provided alongside nutritional labels to allow consumers to recognize ultra-processed foods. Epidemiological studies confirm the importance of each of these dimensions in the development of chronic diseases, acting through distinct mechanisms. Several studies have shown that the negative associations with health linked to ultra-processed foods remain significant even after adjusting for dietary nutritional quality. Likewise, the effect of the nutritional component is also independent of the level of processing/ultra-processing: for instance, in the NutriNet-Santé cohort, the associations between the nutritional score underlying the Nutri-Score and cancer risk remain significant after adjusting for the proportion of ultra-processed foods in the diet (98). The same holds true in the Epic cohort regarding the risk of cardiovascular diseases (43).
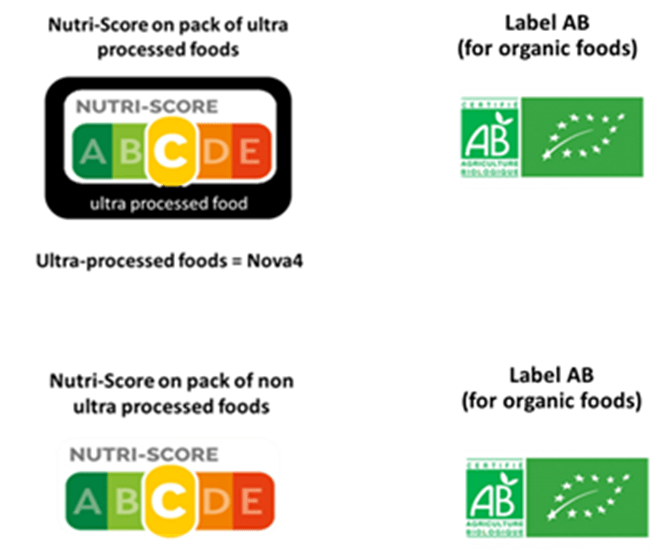
To provide simple and clear combined information to consumers about both dimensions—nutritional quality and ultra-processing—it is feasible to add a black border to the Nutri-Score for ultra-processed foods (labeled as Ultra-Processed Food). The comprehensibility of such a system has been tested in a randomized controlled trial involving over 20,000 participants (99). The combined label associating the Nutri-Score and a graphical indication of when a food is ultra-processed (black banner = NOVA4) allowed participants to independently understand these two complementary dimensions of foods.
Similarly, it is entirely reasonable to expect potential divergences between whether a food is organic and whether it can be ultra-processed or have an unfavorable nutritional quality (high in fats, sugars, or salt), and thus be poorly ranked by the Nutri-Score. For instance, organic chocolate remains an ultra-processed, calorically dense, sugary, and fatty food. This is why it is beneficial to display alongside the Nutri-Score, combined with a black border to indicate whether the food is ultra-processed, the official organic label AB, which provides information about this other complementary dimension (100).
5.2. The Nutri-Score cannot include in its calculation all nutrients of interest found in foods: vitamins, minerals, polyphenols, free sugars, different types of fatty acids…
As mentioned previously (chapter 2.1), this data is currently not available because these elements are not part of the nutritional declaration (Nutrition Facts table) mandated by European regulations (17), which prevents their integration into the development of any nutritional label. Nevertheless, the Nutri-Score algorithm does take into account positive elements such as fruits and vegetables, which serve as proxies for certain vitamins (like vitamin C and beta-carotene), and proteins, which are proxies for certain minerals (like calcium and iron). Thus, through these proxies, the algorithm underlying the calculation of the Nutri-Score considers many more elements than just the ones explicitly listed for its calculation.
5.3. The Nutri-Score does not provide information on the nutritional quality of a portion of food.
The Nutri-Score is calculated for 100g (or 100ml) and not per serving (101). This is because the available data displayed in the nutritional table mandated by European regulation INCO (n°1169/2011) (17) is expressed for 100g (or 100ml) of food. Indeed, serving sizes are difficult to define for foods as they vary according to individual energy needs, which themselves differ based on age, sex, growth level, pregnancy status, physical activity/sedentary lifestyle, etc. Therefore, it is challenging to create a universal label based on different serving sizes or to display multiple labels on packaging according to different population sub-groups.
Since serving sizes cannot be scientifically standardized, they are defined by the manufacturers themselves when displayed on packaging, and are often much smaller than the actual portions consumed, leading to a real risk of manipulation: manufacturers can use smaller serving sizes to artificially reduce the perceived amounts of fat, sugar, or salt in their products. For example, breakfast cereal manufacturers often suggest a serving size of 30g, while it is known that most adolescents consume 60 or 80g per serving. Likewise, manufacturers of chocolate bars sold in pairs generally suggest a serving corresponding to one bar out of the two in the package.
Using a standard quantity, such as 100g (or 100ml), is the best choice, as it provides a common denominator allowing for valid comparisons between foods without inducing estimation errors. This enables comparisons of 100g of one type of breakfast cereal to 100g of another type; 100g of one pizza to 100g of another pizza; 100g of Comté to 100g of Roquefort or Mozzarella; 100ml of olive oil to 100ml of another oil.
6. Deployment of the Nutri-Score in France
6.1. Adoption of the Nutri-Score by economic actors
When the Nutri-Score was proposed by scientists in 2014, no food company supported it or agreed to display it, and only six companies accepted it at its official launch in 2017. Today, over 1,450 brands have adopted it, representing about 62% of the French food market. The list of companies that have adopted it is accessible and regularly updated on the Santé Publique France website (102).
However, major food groups have rejected and fought against it for many years (such as Ferrero, Coca-Cola, Mars, Lactalis, Mondelez, Kraft, etc.). Some companies, like Danone and Bjorg, who previously adopted it in 2017, have recently decided to remove it from their brands to protect their economic interests, which were not satisfied by its update in 2023, made by scientists (voir chapitre 9.), that legitimately made it stricter for a number of highly sugary or salty products. The decision of these companies to withdraw demonstrates that, contrary to the virtuous image they try to project, they primarily consider their commercial and marketing interests rather than the health interests of consumers (103).
To achieve optimal effect from the Nutri-Score, it must be displayed on all foods offered to consumers. To compel economic actors that refuse to display the Nutri-Score, as its adoption is voluntary, many public health actors, various scientific societies, consumer and patient associations, and NGOs are calling for it to be made mandatory.
6.2. Adoption of the Nutri-Score by consumers
Various studies conducted by Santé Publique France and the Ministry of Health (104-108) have shown that the Nutri-Score is popular among consumers: about 94% of French people support the measure, and a similar proportion would favor making the Nutri-Score mandatory. Comparable figures have been found among adolescents. Furthermore, in these studies, 57% of consumers reported having changed at least one of their food purchases thanks to the Nutri-Score since its implementation.
A survey conducted in 2024 by the specialized firm OpinionWay (109) also highlighted that to “eat better,” consumers first consult the Nutri-Score, which has become the primary source of information ahead of ingredient composition (with a significant upward trend over recent years).

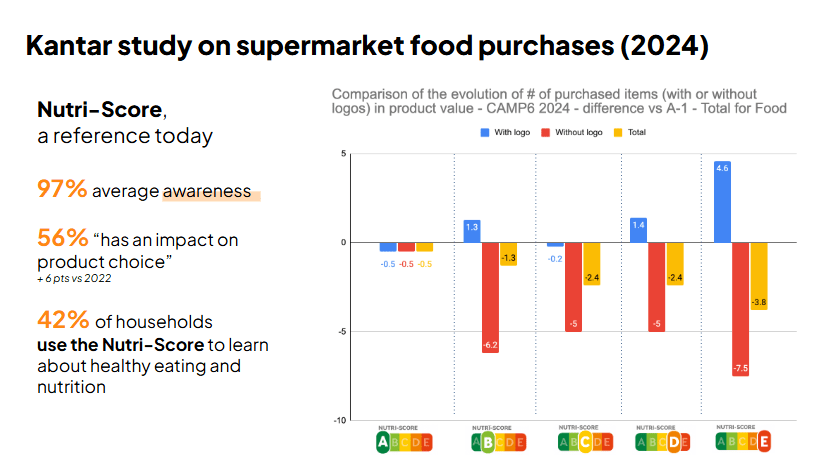
Another study conducted in 2024 by Kantar (Worldpanel) found that with a recognition rate of 97%, the Nutri-Score has become a reference criterion for a majority of consumers, influencing the purchasing decisions of 56% of them (110). Concerning food purchases in supermarkets: 1) products with good Nutri-Score ratings perform better, and 2) those displaying the Nutri-Score have better performance than those that do not, even for products rated D or E.
Similarly, a new study conducted in 2025 by the company Sensia (111) analyzed over 32,000 online consumer reviews of 100 food products with Nutri-Scores ranging from A to E, belonging to various strategic categories of food (dairy and dairy products, sweet grocery, savory grocery, plant-based nutrition). The study identified common dynamics across all categories:
- Preference for Nutri-Scores A and B: products rated A and B dominate consumer choices, perceived as offering the best balance between health and taste. These categories are often associated with balanced products that meet nutritional expectations without sacrificing flavor.
- Role of the Nutri-Scores C, D, and E: although less preferred, these products appeal due to their indulgent or convenient nature. They often occupy an “occasional” place in consumers’ diets, associated with moments of pleasure or nostalgia.
- Sensitivity to Price and Price-Quality Ratio: price remains a determining factor in product selection, even for the highest-rated categories (A and B).
The findings of this study show that consumers understand how to use the Nutri-Score effectively, noting that products rated D or E can be consumed but should be done so occasionally. This demonstrates that consumer behavior is consistent with the objectives of the Nutri-Score and aligns perfectly with their perception of the Nutri-Score with public health nutrition recommendations (sugary, fatty, and/or salty products can be consumed within a balanced diet but not too frequently and/or in small quantities).
These results are also in complete agreement with scientific studies (conducted in virtual supermarkets, experimental stores, and real-life sales conditions) analyzing the shopping baskets of consumers exposed to the Nutri-Score and with the sales statistics of food products in supermarkets based on their Nutri-Score.
6.3. Real Effects on product sales in supermarkets
The impact of implementing the Nutri-Score on consumer purchasing behavior is also demonstrated by the analysis of food sales in supermarkets based on their Nutri-Score (112). In France, between 2022 and 2023, sales of products rated A and B increased (by +6.3% and +4.5%, respectively), while sales of products rated D and E decreased (-1.7% and -6.9%).

This effect on product sales according to the Nutri-Score has also been found in Spain regarding sales of products in supermarkets (by the EROSKI chain).

6.4. Effect on reformulations
The application of the Nutri-Score appears to be an effective lever to encourage manufacturers to rebalance the recipes of certain products to improve their nutritional quality and achieve better ratings on the Nutri-Score scale. An American study showed that, since the Nutri-Score was adopted in France in 2017, new products launched or modified are of better nutritional quality compared to those in Italy or the UK, two countries that have not adopted the Nutri-Score (113).
Similarly, a study by UFC-Que Choisir also highlighted the beneficial effect of the Nutri-Score on the reformulation of manufacturers’ recipes (114). Indeed, the nutritional quality of foods has significantly progressed since 2015 in the aisles where the Nutri-Score is prominently displayed. Conversely, in categories of foods where it is displayed very little, no major nutritional improvements have been observed.
6.5. Expansion of the Nutri-Score to collective catering
The expansion of the Nutri-Score to collective catering aims to better inform canteen patrons about the nutritional quality of the foods and dishes offered in collective and commercial catering, facilitating their choices for health purposes, and encouraging managers to provide dishes with favorable nutritional qualities for health. In the framework of calls for projects by the Directorate General of Health (Ministry of Health) launched in 2019 and 2020, pilot studies were conducted to test the feasibility and impact of the Nutri-Score in collective (university, corporate) and commercial (fast food, delivery) catering. The assessment of these pilot studies has been published (115), presenting the calculation principles of the Nutri-Score for a recipe and practical applications in out-of-home catering. These studies showed that displaying the Nutri-Score improves the nutritional quality of chosen meals, with a reduction in sugar and saturated fat intake. Specifically, a study conducted in 455 school canteens and 642 corporate restaurants (ELIOR) found that 71.8% of diners indicated that the display influences their choices, and 94.4% wish to see it continued (116).
Ultimately, clear and visual information helps to choose more balanced dishes, especially in school canteens where eating habits are formed. The application of the Nutri-Score in collective catering also contributes to raising chefs’ awareness of good nutritional practices (reduction of salt, sugar, fats) and encourages them to reformulate recipes to improve their scores. This expansion into collective and commercial catering (university, corporate, fast food) is already being implemented by various companies and requires a decree for an experimental phase expected to start in 2025, as outlined in the SNANC projects (4).
6.6. Expansion to bulk foods
There is a plan to extend the Nutri-Score to bulk products, allowing it to be displayed on raw, non-pre-packaged products sold in bulk, such as fruits and vegetables, legumes, nuts, bread, meat, charcuterie, fish… This measure, useful for helping consumers make informed purchasing choices, was included in the National Nutrition Health Program (PNNS4 2019-2025) (117) and is also part of the SNANC project (4). The calculation methodology, relying on the generic food composition table (CIQUAL/ANSES), has been defined by the Ministry of Health. Its implementation as a three-year experiment is planned, with a review allowing for potential adjustments at the end of the experiment. As with collective catering, an experimental phase is expected to officially begin in 2025, extending the Nutri-Score to non-pre-packaged goods.
6.7. Support for the Nutri-Score to become mandatory on foods
Over 2,500 scientists and health professionals have signed a public statement demanding that the display of the Nutri-Score on the front of food packaging be made mandatory in France (118). Numerous expert committees, scientific societies (representing tens of thousands of experts in nutrition, dietetics, pediatrics, public health, oncology, cardiology, general medicine, etc.), many consumer and patient associations, and multiple concerned NGOs have supported the call for the Nutri-Score to be made mandatory in France (118).
To reduce healthcare expenditures, the Health Insurance in its report “Charges and Products for 2026” published in 2025 proposed making the Nutri-Score mandatory for all packaged food products and in advertisements (119).
Similarly, in a report on obesity prevention and management published in 2019, the Court of Auditors (Cours des Comptes) deemed that the Nutri-Score should be made mandatory on the packaging of all foods to be fully effective (120). In its new report “Prevention and Early Management of Diabetes” (2025), the Court of Auditors called for a ban on advertising targeting minors for Nutri-Score products rated D and E, including on social media (121).
Likewise, in 2025, the Economic, Social and Environmental Council (CESE) encouraged national use of the Nutri-Score for all processed and pre-packaged products and wishes for it to be made mandatory at the European level (122).
The Nutri-Score is supported by over 90% of consumers, adopted by over 1,500 brands, and endorsed by 144 parliamentarians who signed a statement requesting its mandatory status (123).
7. Deployment of the Nutri-Score in Europe
After its official adoption in France in 2017, Belgium, Spain, Luxembourg, Germany, the Netherlands, and Switzerland also adopted the Nutri-Score as the official label, and they were joined by Romania in 2025.
On February 12, 2021, the seven countries that had adopted the Nutri-Score officially committed to European coordination to facilitate its use. A steering committee allows the countries to coordinate a simple and effective deployment of the label for economic operators and consumers. This steering committee is also responsible for evaluating the nutritional algorithm of the Nutri-Score and has established a scientific committee tasked with the technical work for updating the Nutri-Score (which was done in 2022-2023, see chapter 9).
However, the implementation of the Nutri-Score by the countries that have adopted it is currently only optional, due to European regulations that do not allow member states to make a simple nutritional label mandatory on food packaging. Nonetheless, as part of the EU’s “From Farm to Fork” strategy, the European Commission announced in 2020 its intention to select a unique nutritional label that would become mandatory for Europe. Given its scientific basis and the multitude of research works validating its calculation algorithm and graphical format, along with support from the scientific community and consumer associations, the Nutri-Score was considered the most credible option.
The mandatory nutritional label at the European level was supposed to come into effect before the end of 2022. This did not happen and was postponed to 2023, then 2024, and still has not been implemented as of today. Yet, the various prerequisites set by the European administration had been met: 1) a report from the European Food Safety Authority (EFSA) providing the nutritional elements to be considered in the construction of a nutritional label, corresponding to those available in the nutritional table used for the calculation of the Nutri-Score; 2) the statement from the EU’s Joint Research Centre, whose comprehensive scientific report (published in 2022) on nutritional labels concluded on the effectiveness and superiority of interpretative color systems (such as the Nutri-Score, which ticks all the boxes) (see chapter 4.3.); and 3) the public consultation launched by the European Commission between December 2021 and March 2022 aimed at gathering the views of EU citizens (and from third countries) as well as professional and non-professional stakeholders regarding initiatives to revise EU legislation on consumer information about food, particularly nutritional labeling on the front of packaging (see chapter 4.4.). This consultation showed that stakeholders (research institutions, public health authorities, consumers/citizens, NGOs) supported a graded label like Nutri-Score, excepted the economic operators.
However, on February 19, 2024, the European Commissioner for Agriculture, Christophe Hansen, in his statement presenting the EU’s vision for the future of agriculture and food, no longer mentions certain health-related measures for consumers that were proposed by the European Commission in 2020 as part of the “Farm to Fork” initiative, notably the measure concerning a mandatory nutritional label (despite the numerous scientific studies demonstrating the interest and effectiveness of the Nutri-Score—over 150 studies—and the results of the roadmap set by the European Commission (EFSA report, JRC report, public consultation) that favor the Nutri-Score.
This can be explained by the fact that, faced with the perspective of a nutritional label becoming mandatory for all European countries, and that this label would be the Nutri-Score, powerful lobbies mobilized to exert pressure on European decision-making bodies (126). At the root of the anti-Nutri-Score pressures at the European level are large food companies that have always opposed its implementation (like Ferrero, Lactalis, Coca-Cola, Mars, Mondelez, Kraft), as well as certain agricultural sectors, particularly those of cheese and processed meat, represented by their powerful European organization, COPA-COGECA. These lobbying actions are supported at the European level by various political parties and politicians close to them, especially the Italian government (particularly since the last Italian elections), which has instrumentalized the Nutri-Score as a plot by Europe against “Made in Italy” products, spreading numerous fake news and being particularly active in European structures to block the Nutri-Score (127).
Although this lobbying relies on absurd and dishonest arguments and numerous fake news, it seems to have been effective enough to lead the European Commission to not uphold its commitments regarding the evolution of European regulations on nutritional labeling of foods. To be optimally effective and fully useful to consumers, the Nutri-Score should be present on all food packaging.
Thus, while there is no official statement from the European Commission affirming that the adoption of a mandatory nutritional label for Europe, particularly the Nutri-Score, has been abandoned, the Commission no longer places this measure on its agenda. It continues to claim that it is working on this topic that is “a complex issue…” (128).
8. Responses to common misinformation about the Nutri-Score
Since it was proposed by scientists in 2014, a number of negative opinions and misleading information about the Nutri-Score have circulated repeatedly in press releases from economic operators, on social networks, in various media outlets, and even from prominent political figures. Despite strong support at the European level from the scientific and public health community, consumer associations, and many NGOs concerned with food issues, its detractors have continued to try to discredit it. This phenomenon persists and has even intensified recently due to discussions in the European Community institutions in Brussels to choose a unique and mandatory nutritional label for Europe
Agri-food lobbies (some large industrial groups and various agricultural sectors) are at the root of a significant portion of this misinformation targeting the Nutri-Score. Such misinformation can also come from all kinds of “gurus,” ordinary internet users, media commentators, or political representatives who express not public health arguments backed by scientific work, but rather personal opinions (often self-interested due to economic stakes) that, through a few exaggerated examples, aim to discredit the entire system. The fake news circulating about the Nutri-Score on social networks and in certain media outlets are entirely distinct from legitimate criticisms that can be raised concerning the Nutri-Score, which are part of a useful scientific debate (notably concerning the system’s limitations), both in terms of objectives and form.
Fake news are often characterized by the juxtaposition of elements that may seem accurate individually, but whose presentation can contribute to confusion or cast doubt among those who lack perspective or sufficient knowledge about the Nutri-Score, its objectives, and how it is calculated and used.
What is striking is that this misinformation spills over from social networks and is taken up as “scientific elements” by certain (sometimes significant) media and by all those who have an interest in using it (lobbies, scientists with conflicts of interest with economic operators, political figures, ministers…). These fake news items are sometimes repeated by well-meaning individuals who do not sufficiently understand the issue of nutritional labels or by those defending economic or even ideological interests. Below are some examples of arguments raised by the detractors of the Nutri-Score and the responses that scientists provide:
8.1. The Nutri-Score would penalize traditional foods, particularly AOP/IGP products that are considered “good”?
The Nutri-Score only takes into account the nutritional composition of foods, whether they are traditional or not, with an origin label or not (129). In fact, AOP/IGP labels indicate that a food is tied to a specific region, produced according to often ancestral know-how and is part of culinary heritage, but these labels do not incorporate the notion of “nutritional quality” in their definition and thus in their attribution (that’s not their role). Therefore, even with an AOP or IGP label, fatty, sugary, or salty foods remain fatty, sugary, or salty. It is important for consumers to be informed about this, just like with all foods.
Contrary to what is suggested by those who want to imply that the Nutri-Score is systematically unfavorable to products with an origin label (an argument often made by cheese and charcuterie producers), not all traditional foods are penalized by the Nutri-Score. A recent study by UFC Que Choisir showed that 62% of traditional foods are classified A, B, or C (130). Only cheeses and processed meat receive D and E scores due to their high content of saturated fats and salt (and some, which are less fatty and less salty, are classified as C). This does not indicate that they should not be consumed; rather, being rated D or E by the Nutri-Score simply reminds consumers that these products should be consumed in limited quantities and/or less frequently.
There is therefore no conflict between the information provided by the Nutri-Score and that given by origin labels. These are two pieces of information of different natures that do not cover the same issues. Displaying the Nutri-Score alongside origin labels is entirely consistent with the concept of “consuming less but better.” For the same budget, if consumption needs to be limited as indicated by the Nutri-Score, these other labels can help direct choices toward quality, local, artisanal products. Of course, nothing prevents us from communicating that, among cheeses, it is advisable to favor those that are AOP or IGP compared to those that are not.
8.2. The Nutri-Score would penalize Mediterranean diet ?
It is the Italian lobbies of processed meat and cheeses (supported by producers from other European countries) that try to suggest that the Nutri-Score opposes Mediterranean diet, arguing that Italian cold cuts and cheeses (such as pecorino, parmesan, gorgonzola, San Daniele ham, salami, etc.) classified D or E by the Nutri-Score (due to their high salt and saturated fat content) are nonetheless pillars of the Mediterranean diet model. However, nutritionists argue that the health-promoting Mediterranean diet model does not promote cheeses and cold cuts (whether Italian or not). It is characterized by an abundant consumption of fruits and vegetables, legumes, whole grains, moderate consumption of fish, and limited intake of meats, cold cuts, cheeses, and sugary, fatty, and salty foods. Additionally, olive oil should be favored among added fats, as reflected in its B ranking (since the update of the Nutri-Score), the best possible score for vegetable oils.
Lobbies deliberately create confusion between foods that symbolize Italian culinary heritage (cold cuts, cheeses,) and those promoted by the Mediterranean diet model. These two things are entirely unrelated ! Designed by scientific experts in nutrition, the Nutri-Score does not oppose the Mediterranean diet; on the contrary, the staple foods of this model have been shown to be well classified by the the Nutri-Score, as demonstrated in the classification of foods in the pyramid of the Mediterranean diet compared to the Nutri-Score scale.
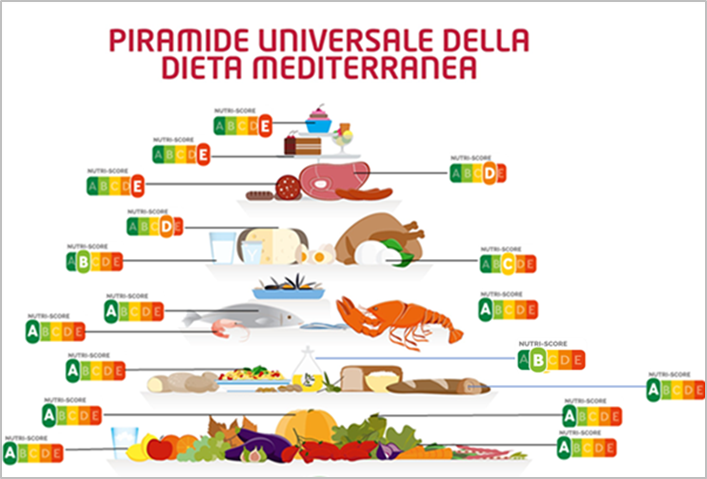
Moreover, a study conducted by Greek university researchers (131) shows that the Nutri-Score aligns well with the Mediterranean food pyramid (the traditional pyramids from 1995 and 2020) and successfully distinguishes foods at both ends of the pyramid.
On the other hand, the Spanish SUN cohort study, involving over 20,000 people (38), demonstrated that the algorithm underlying the Nutri-Score is perfectly consistent with the Mediterranean diet model (Adherence to MED-DIET 0-9 points, Mediterranean diet score based on 9 elements proposed by Trichopoulou in 2003 (132)). Furthermore, the conclusion of the Spanish authors is that their results support the implementation of the Nutri-Score in Mediterranean European countries (including Spain, Italy, Greece…).
8.3. The Nutri-Score would be stigmatizing, guilt-inducing, infantilizing, and anxiety-provoking?
These are also phrases often found in the mouths of detractors… Saying that the Nutri-Score is stigmatizing for certain foods makes no sense: the label does not create anything new but merely reflects the reality of the overall nutritional composition of foods and objectifies the differences in nutritional quality that exist between them, which are not obvious from reading the incomprehensible (and often unreadable) nutrition facts table that must appear on the back of food products. Therefore, there is no stigmatization but rather coherence with public health nutritional recommendations: foods that, from a public health perspective, we want to limit consumption of (sugary, fatty, salty foods, processed meats, cheeses…) are identifiable by an orange or red color, which invites more occasional and/or smaller consumption.
As for the descriptors “guilt-inducing,” “infantilizing,” or “anxiety-provoking,” no scientific work or study supports these claims. The arguments that the red color would be stigmatizing for foods or guilt-inducing and anxiety-provoking for consumers lack any serious scientific data. These are pure speculations aimed at dramatizing the image of the Nutri-Score. In contrast, numerous studies published in international scientific journals show that the Nutri-Score is very well perceived and understood (particularly by disadvantaged populations). It is appreciated, and is even favored by 90% of consumers who would like it to become mandatory and who do not complain in any way about being infantilized by this informational tool.
8.4. The Nutri-Score would be an infringement on individual freedoms?
Lobbies also attempt to shift the issue of the Nutri-Score into the realms of morality, ethics, and individual freedoms, implying that dietary choices are the responsibility of individuals and that the Nutri-Score indicates that the state wishes to interfere in the contents of our plates, thereby infringing upon the pleasure and enjoyment of food by banning certain foods and pushing consumers towards standardized diets…
But in reality, individuals’ dietary choices are conditioned by an environment (prices, commercial promotions, in-store placements, advertising…) that encourages the consumption of energy-dense, fatty, sugary, salty foods that are low in fiber. Consumers are therefore not truly free in a context where the marketing pressure surrounding them is extremely strong. In these conditions, providing simple information about the nutritional composition of foods enhances consumers’ freedom of choice at the moment of purchase. In any case, the Nutri-Score has no injunctive or prescriptive character and does not infringe upon individual freedoms. By providing transparency to consumers regarding the nutritional quality of foods (by synthesizing existing data from an incomprehensible nutritional table into an understandable format), it allows them, if they wish, to incorporate nutritional dimensions into their purchasing decisions and thus move towards healthier food choices. Far from being liberticidal, the Nutri-Score provides an element of transparency and coherence that facilitates consumer freedom of choice through informed choices.
8.5. The Nutri-Score would have no scientific basis; the proof is that its calculation algorithm has already changed…
Since it was proposed by scientists in 2014 and as was established during its adoption in France in 2017 (and later in other European countries), it was planned that the Nutri-Score calculation algorithm would evolve and be regularly revised based on advances in scientific knowledge and therefore on nutritional recommendations that are refined according to this new knowledge, as well as based on developments in the food market (the emergence of new products, innovations, reformulations, etc.) and the experience of its real-life deployment.
To this end, a European scientific committee was established within the framework of the transnational governance of the Nutri-Score, gathering the seven countries that adopted the Nutri-Score. This scientific committee, responsible for updating Nutri-Score and composed of independent experts from the seven European countries that have adopted the Nutri-Score, began its work in February 2021. After two years of intensive scientific work, while finding that, overall, the Nutri-Score algorithm functions well, this committee proposed modifications to its calculation method impacting a limited number of foods to improve its performance in line with new scientific data and to better align with current nutritional recommendations.
It is therefore entirely normal and desirable for updates of the Nutri-Score to occur regularly (they are planned every three years). This is a fundamental and reassuring element in terms of public health.
As for accusing the Nutri-Score of having no scientific basis, it grossly overlooks the hundreds of studies published in international scientific journals validating both its calculation algorithm and its effectiveness in terms of perception, understanding, use, and impact on the nutritional quality of shopping baskets!
9. The Update of the Nutri-Score
9.1 Why the update of the Nutri-Score and how It was done
When it was proposed by scientists in 2014 and officially adopted in France in 2017, as well as in six other European countries (Belgium, Germany, Luxembourg, the Netherlands, Spain, and Switzerland), it was agreed that the Nutri-Score would be updated regularly based on the evolution of knowledge in the field of nutrition, the evolution of the food market (to take into account innovations and reformulations by industry), and the experience gained since its implementation.
In 2021, the transnational governance of the Nutri-Score, which brings together the countries that have officially adopted it, mandated a scientific committee composed of experts without conflicts of interest from the seven countries to carry out the update of the Nutri-Score calculation method. After two years of scientific work, the committee published two very comprehensive reports on general foods and on beverages (133,134). These documents proposed improvements to the initial Nutri-Score algorithm while maintaining its general structure. While stating that the classifications of foods by the current Nutri-Score were generally adequate from a nutritional standpoint, the committee proposed modifications to the calculation method for various categories of foods.
9.2. What changes for the algorithm?
The specific modifications to the algorithm proposed by the Scientific Committee (135) are as follows:
- An increase in the penalty points for sugar content (15 points instead of 10 in the initial version). This choice is explained by a recent EFSA report which demonstrated that there is no minimal sugar content threshold that is risk-free for health, and aims to align with European regulation to allow for a more appropriate classification of sugary products.
- An increase in the penalty points for salt content (20 points instead of 10). This change is related to the fact that high sodium intake raises blood pressure and the risk of hypertension, which is a risk factor for cardiovascular diseases and chronic kidney failure. Furthermore, this change reflects the desire to align with current European Union rules on nutrient labeling. It aims to better discriminate highly salted foods to encourage less salty versions and/or to stimulate reformulation by manufacturers.
- A modification in the allocation of points recognizing fiber content to allow for better discrimination between refined and whole grain products, thus aligning with public health nutritional recommendations.
- An increase in points for protein (up to 7 points), with a cap on points for red meat protein (maximum 2 points): protein levels also reflect calcium and iron intake, so this increase allows for better discrimination of foods that are sources of these nutrients. The limitation on protein consideration regarding red meat is justified by studies highlighting links between high intakes of red meat and cancer risks, particularly colorectal cancer.
- A change in the component “fruits, vegetables, legumes, dried fruits, and oils from rapeseed, olive, and nuts,” which now counts only fruits, vegetables, and legumes (oily fruits are now categorized with fats due to their high lipid content).
- A modification of the threshold between score A and score B.
Regarding beverages, milk, dairy drinks, fermented dairy drinks, and plant-based beverages are now included in the beverage category (not previously classified as general foods). This modification is motivated by the consumption and usage patterns of these products (liquid foods that are, by definition, drunk and primarily consumed—alone or with other components—as drinks), as well as the intention to improve the ability to better discriminate them based on their nutritional composition. This particularly aims to objectify the differences in their sugar and saturated fat content.
Modifications have been proposed for energy components, those for sugar and protein, the positive component “fruits and vegetables,” and the addition of an additional negative component, with 4 points assigned for the presence of sweeteners in the beverage. This last justification is based on recent scientific work that has not demonstrated a benefit from sweetened beverages and suggests a possible detrimental effect for certain sweeteners. Additionally, there is a potential risk that reducing sugar content in beverages may be associated with increased use of sweeteners. For all these reasons, public health recommendations in Europe aim to limit their consumption.
Finally, the threshold related to the presence of proteins (initially set for negative products as above 11) has been removed. Indeed, maintaining this threshold would have caused classification issues for certain whole dairy products.
9.3. Impact on food classification
Overall, the modifications to the algorithm lead to a stricter ranking of products, except for a few targeted groups. Sugary and salty products are classified less favorably due to the now more punitive allocation of points.
9.3.1. Impact on sweet breakfast cereals
In recent years, these products have undergone reformulation, significantly reducing their sugar content (for some as Chocapic from over 40 g to 20-22 g of sugar per 100 g of cereal). Additionally, the concomitant reduction in salt content and the addition of whole wheat, a source of fiber, have allowed them to gradually move from a C to a B rating, and finally just below the threshold for an A rating. The manufacturer’s reformulation effort is commendable. However, these cereals still contain relatively high amounts of sugar and are thus classified back to C, allowing for discrimination compared to plain cereals that contain little to no sugars (0 to 7 g/100 g), which maintain an A rating. It should be noted that even at a C rating, these “reformulated” cereals are still better rated than their competitors who have made no effort to reduce their sugar content; these competitors generally contain between 30 to 40 g of sugar per 100 g, placing them in D or E categories.
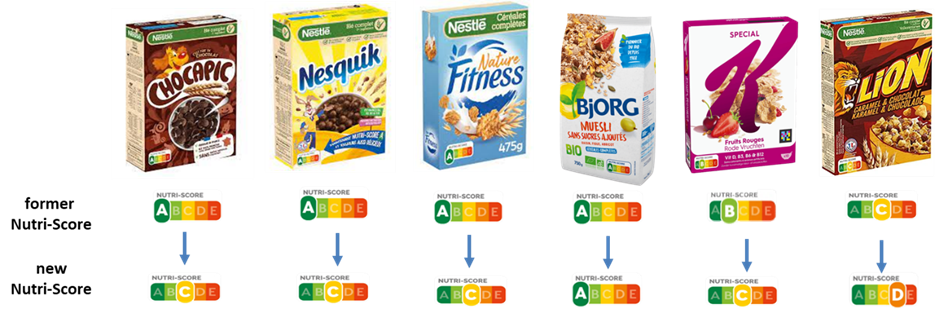
9.3.2. Impact on ready-made dishes
Ready-made dishes, especially those high in saturated fats or salt, are classified less favorably, moving on average from classes A/B to classes B/C, and even D for certain product categories, notably some pizzas.

9.3.3. Impact on cereal products
Whole grain breads, which are high in fiber, are generally rated A, whereas white breads (refined, thus lower in nutrients and fiber) fall into B or C categories depending on their salt content.
9.3.4. Impact on nuts and seeds
Unsalted and unsweetened nuts and seeds are mostly rated A or B, while salted and/or sweetened versions generally fall into C or D.
9.3.5. Impact on added fats
Oils with low saturated fat content (like olive, canola, walnut, and high oleic sunflower oil) are now categorized B, while other oils are rated C or D based on their saturated fat levels. Coconut oil and butter remain in E due to their high saturated fat content.
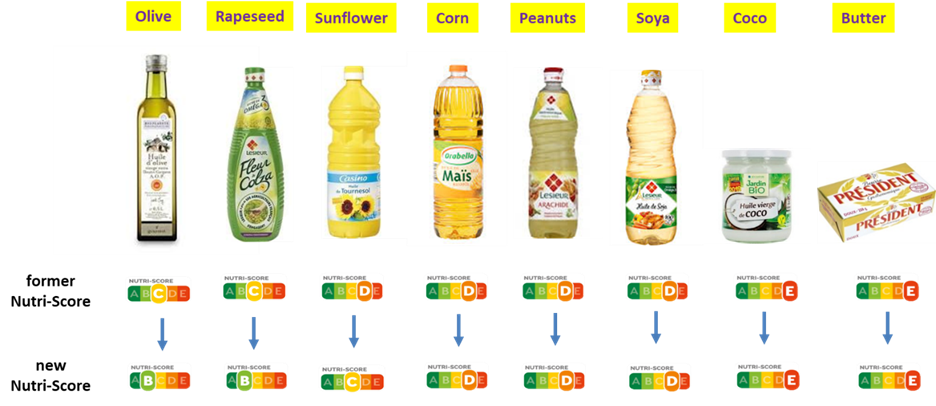
9.3.6. Impact on cheeses
Low-salt pressed cheeses (like Emmental) move from D to C, while other cheeses remain in C, D, or E depending on their salt and saturated fat content, which is linked to an increased risk of chronic diseases, particularly cardiovascular diseases.
9.3.7. Impact on meats
Red meat (whose excessive consumption is considered high-risk for certain cancers) is rated less favorably than poultry or fish (whose consumption is not associated with negative health effects).
9.3.8. Impact on seafood products
Seafood products, particularly fatty fish without added salt or oil, are primarily classified in categories A and B of the Nutri-Score, justified by epidemiological studies highlighting their positive health effects, particularly due to their high omega-3 content
9.3.9. Impact on beverages
Water remains the only beverage rated A. Sweetened drinks with very limited sugar content (around <2 g/100 mL) are classified as B, while those with high sugar quantities remain in D/E, allowing for better discrimination of beverages based on their sugar content.
Beverages containing sweeteners are no longer rated B as initially but are now rated C (or even D or E for those containing both sweeteners and sugar).

Skimmed and semi-skimmed milk are categorized as B, placing them in the most favorable Nutri-score classes for beverages, since only water is rated A. They are now differentiated from whole milk, which is rated C.
Sweetened liquid dairy products are also less favorably rated. This downgrade is justified, as the initial calculation method of the algorithm was less penalizing for sugar in general food calculations, allowing certain flavored milks (chocolate, strawberry, vanilla, etc.) and sweetened drinking yogurts to receive too favorable ratings.
Now, “flavored milks” and “sweetened dairy drinks” are no longer classified as A or B (as they were previously), but mainly fall into D and E (some of these low-sugar beverages may find themselves in C). Similarly, fermented dairy drinks (including sweetened and flavored drinking yogurts) are no longer classified as A but will be differentiated based on their sugar content between Nutri-score classes C and E.
Example of Impact on dairy products
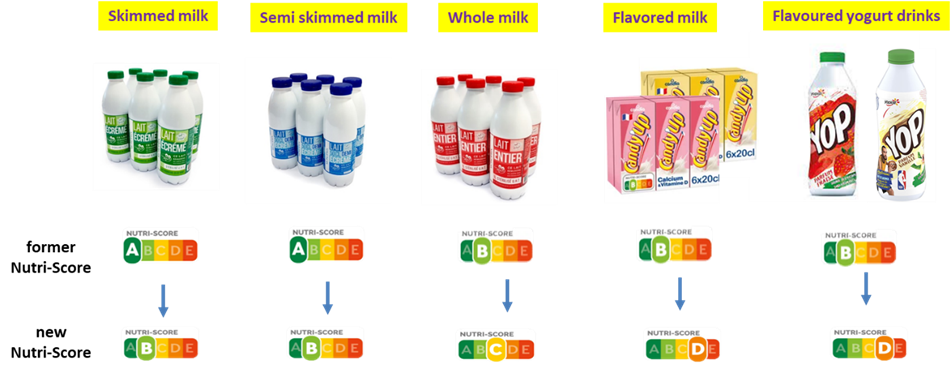
Example of Impact on drinking yogurts

Plant-based beverages (including those made from soy, almond, oat, rice, etc.) are no longer classified as A or B as initially. They now fall between classes B and E based on their nutritional composition, particularly their sugar levels.
Example of Impact on plant-based beverages

9.3.10. Impact on cocoa powders
Cocoa powders now have the same classification overall, regardless of how their nutritional declaration is presented. The European regulation on consumer information stipulates that the nutritional declaration of a product may be presented for the product as prepared if it cannot be consumed as sold.
Cocoa powders took advantage of this by often indicating nutritional values per 100 g or 100 mL of prepared product, typically containing a significant amount of semi-skimmed milk. This allowed them to be assigned a rather favorable Nutri-score (generally B). With the update of the algorithm, whether the declaration is made for the product as sold or reconstituted with milk, the Nutri-score is generally the same, which is D.
The classification of cocoa powders has been revised to limit biases related to the preparation of beverages utilizing them.
Example of Impact on cocoa powders
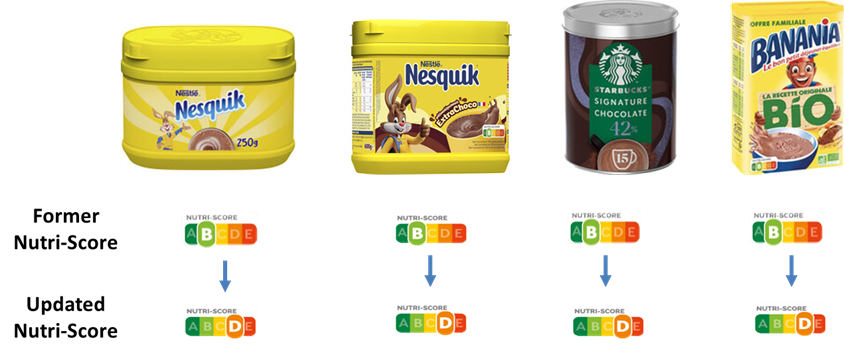
For other food groups, the current classifications remain unchanged.
9.4. General impact on Ultra-Processed Foods
The update of the Nutri-Score algorithm has led to a reduction in the number of ultra-processed products rated A and B, and an increase in the number of products rated D or E. Unprocessed foods have been the least affected, while ultra-processed foods have been most impacted. With the new version of the Nutri-Score, the vast majority of ultra-processed products are rated C, D, or E, increasing from 77.9% in the initial version to 87.5% in the revised version. These results show that the update of the Nutri-Score reinforces its consistency with the NOVA classification, even though the two systems measure two distinct dimensions of the health value of foods, necessitating the graphical coupling of both pieces of information (as proposed by the addition of a black banner for ultra-processed products rated NOVA4).
Overall, the revised version of the Nutri-Score addresses some of the limitations identified since its implementation. It particularly allows for better coherence and alignment with recent nutritional recommendations in Europe, benefiting consumers and public health. This update was supposed to take effect on January 1, 2024, in the seven countries that adopted it. However, in France, it only came into effect in March 2025, due to intense lobbying by certain industries that led to a blockage by the Ministry of Agriculture (136). Manufacturers are granted a two-year period to apply it in order to clear their stock and update their labels.
10. Conclusion
Although the effectiveness and relevance of the Nutri-Score have been widely demonstrated, it is, like all nutritional logos, just one element of a public health nutrition policy. It should, of course, be associated with other complementary measures as part of a strategy that addresses public health challenges (education, regulation of advertising and marketing, particularly aimed at children, taxation/subsidy systems based on the nutritional quality of foods, improvement of the food supply, promotion of physical activity, etc.). Similarly, it in no way substitutes for the work of health and nutrition professionals. However, it serves as a tool they can use in the care of their patients.
Finally, it must be accompanied by communication and educational information for proper use, with frontline health professionals being essential conduits.
Nonetheless, the Nutri-Score nutritional label represents a genuine public health tool based on solid scientific foundations. It is a simple preventive measure capable of contributing to reducing the risk of chronic diseases and has, beyond its impact on consumer health, an economic and social impact.
Références
1. Légifrance: Arrêté du 31 octobre 2017 fixant la forme de présentation complémentaire à la déclaration nutritionnelle recommandée par l’Etat en application des articles L. 3232-8 et R. 3232-7 du code de la santé publique. https://www.legifrance.gouv.fr/jorf/id/JORFTEXT000035944131
2. Elucid. « Les lobbys contre la santé : la folle histoire du Nutri-Score ». Entretien avec Serge Hercberg détaillant les stratégies des lobbies agroalimentaires et leur influence politique. https://www.youtube.com/watch?v=ZV_AkybpeGY
3. World Health Organization. Non communicable diseases. 16 septembre 2023. https://www.who.int/news-room/fact-sheets/detail/noncommunicable-diseases
4. Gouvernement : Stratégie nationale pour l’alimentation, la nutrition et le climat 2025 / 2030 https://agriculture.gouv.fr/consultation-publique-projet-de-strategie-nationale-pour-lalimentation-la-nutrition-et-le-climat
5. FAO. 2023. The State of Food and Agriculture 2023 – Revealing the true cost of food to transform agrifood systems. Rome. https://openknowledge.fao.org/server/api/core/bitstreams/5aac5078-625d-4b94-b964-bea40493016c/content
6. IHME (Institute for Health Metrics and Evaluation). Global Burden of Disease Collaborative Network, Global Burden of Disease Study 2019 (GBD 2019) Results (2020,) https://vizhub.healthdata.org/gbd-results/
7. Santé Publique France. Le Programme National Nutrition Santé (PNNS) https://www.mangerbouger.fr/ressources-pros/le-programme-national-nutrition-sante-pnns
8. Santé Publique France. L’essentiel des recommandations sur l’alimentation https://www.santepubliquefrance.fr/determinants-de-sante/nutrition-et-activite-physique/documents/depliant-flyer/l-essentiel-des-recommandations-sur-l-alimentation
9. Grunert KG, Fernandez-Celemin L, Wills JM, Storcksdieck Genannt BS, Nureeva L. Use and understanding of nutrition information on food labels in six European countries. ZGesundhWiss. juin 2010;18:261 77
10. Rayner, M, Scarborough, P, Stockley, L. Nutrient Profiles: Applicability of Currently Proposed Model for Uses in Relation to Promotion of Foods to Children Aged 5–10 and Adults London: Food Standards Agency; 2005.
11. Hercberg S. Rapport : Propositions pour un nouvel élan de la politique nutritionnelle française de santé publique dans le cadre de la Stratégie Nationale de Santé https://sante.gouv.fr/IMG/pdf/rapport_Hercberg_15_11_2013.pdf
12. Haut Conseil de la Santé Publique (HCSP). Avis relatif à l’information sur la qualité nutritionnelle des produits alimentaires. 2015 ; http://www.hc;sp.fr/Explore.cgi/avisrapportsdomaine?clefr=519
13. . Agence Nationale de Sécurité Sanitaire, Environnement et Santé au Travail ANSES. 2019; https://www.anses.fr/fr/system/files/NUT2019SA0086.pdf
14. Merz, B., Temme, E., Alexiou, H. et al. Nutri-Score 2023 update. Nat Food 5, 102–110 (2024). https://doi.org/10.1038/s43016-024-00920-3
15. Rayner M, Scarborough P, Boxer A, Stockley L. Nutrient Profiles: Development of Final Model. London: Food Standards Agency; 2005.
16. Rayner M, Scarborough P, Stockley L. Nutrient Profiles: Options for Definitions For use in Relation to Food Promotion and Children’s Diets. London: Food Standards Agency; 2004.
17. Journal Officiel de l’Union Européenne. Règlement (UE) no 1169/2011 du Parlement Européen et du conseil du 25 octobre 2011. https://www.senat.fr/europe/textes_europeens/ue0120.pdf
18. Townsend MS. Where is the science? What will it take to show that nutrient profiling systems work? Am J Clin Nutr. 2010 ; 91 : 1109S-15S.
19. Grunert KG, Wills JM. A review of European research on consumer response to nutrition information on food labels. J Public Health. 2007; 15: 385-99.
20. WHO. Guiding principles and framework manual for front-of-pack labelling for promoting healthy dietPre-formatted final draft. 2019. https://www.who.int/nutrition/publications/policies/guidingprinciples-labelling-promoting-healthydiet.pdf?ua=1
21. WHO. Manual to develop and implement front‑of‑pack nutrition labelling. Guidance for countries on the selection and testing of evidence‑informed front‑of‑pack nutrition labelling systems in the WHO European Region. 2020 ; https://apps.who.int/iris/bitstream/handle/10665/336988/WHO-EURO-2020-1569-41320-56234-eng.pdf?sequence=1&isAllowed=y
22. WHO. Appendix : Detailed description of additional validation studies that may be considered to select and evaluate a front-of-pack labelling scheme. 2020 ; https://apps.who.int/iris/bitstream/handle/10665/336989/WHO-EURO-2020-1570-41321-56235-eng.pdf?sequence=2&isAllowed=y
23. Blog Nutri-Score de l’Equipe de Recherche en Epidémiologie Nutritionnelle (EREN), U1153 Inserm/Inrae/Cnam/Université Sorbonne Paris Nord. Bibliographie, https://nutriscore.blog/2022/09/23/bibliography-references/
24. Dréano-Trécant L, Egnell M, Hercberg S, Galan P, Soudon J, Fialon M, Touvier M, Kesse-Guyot E, Julia C. Performance of the Front-of-Pack Nutrition Label Nutri-Score to Discriminate the Nutritional Quality of Foods Products : A Comparative Study across 8 European Countries, Nutrients. 2020 ; 12(5), 1303-1308.
25. Szabo de Edelenyi F, Egnell M, Galan P, Hercberg S, Julia C. Ability of the front-of-pack nutrition label Nutri-Score to discriminate nutritional quality of food products in 13 European countries and consistency with nutritional recommendations. 2020; https://solidarites-sante.gouv.fr/IMG/pdf/rapport_eren_off_7_countries.pdf
26. Mariana Santos, Filipa Matias, Tânia Fontes, Ana Cristina Bento, Maria João Pires, Ana Nascimento, Susana Santiago, Isabel Castanheira, Ana Isabel Rito, Isabel Loureiro, Ricardo Assunção. Nutritional quality of foods consumed by the Portuguese population according to the Nutri-Score and consistency with nutritional recommendations, Journal of Food Composition and Analysis, Volume 120, 2023, 105338, ISSN 0889-1575, https://doi.org/10.1016/j.jfca.2023.105338.
27. Julia C, Ducrot P, Peneau S et al. Discriminating nutritional quality of foods using the 5-Color nutrition label in the French food market: consistency with nutritional recommendations. Nutr J. 2015; 14:100.
28. Julia C, Kesse-Guyot E, Touvier M, Mejean C, Fezeu L, Hercberg S. Application of the British Food Standards Agency nutrient profiling system in a French food composition database. Brit. J. Nutr. 2014; 112: 1699-1705
29. Julia C, Mejean C, Touvier M et al. Validation of the FSA nutrient profiling system dietary index in French adults-findings from SUVIMAX study. Eur J Nutr. 2016; 55 (5): 1901-1910.
30. Deschamps V, Julia C, Salanave B, Verdot C, Hercberg S, Castetbon K. Score de qualité nutritionnelle des aliments de la Food Standards Agency appliqué aux consommations alimentaires individuelles des adultes en France. Bulletin Epidémiologique Hebdomadaire. 2015 : 466-75.
31. Sarda B, Kesse-Guyot E, Salanave B, Verdot C, Ducrot P, Galan P, Hercberg S, Deschasaux-Tanguy M, Srour B, Fezeu LK, Touvier M, Deschamps V, Julia C. Impact of the 2023 revision of the nutrient profiling system underlying Nutri-Score on the association with food intakes and biomarkers in French adults from the National ESTEBAN survey. Eur J Nutr. 2025 Jun 7;64(5):209
32. Donnenfeld M, Julia C, Kesse-Guyot E, Méjean C, Ducrot P, Péneau S, Deschasaux M, Latino-Martel P, Fezeu L, Hercberg S, et al. Prospective association between cancer risk and an individual dietary index based on the British Food Standards Agency Nutrient Profiling System. Br J Nutr. 2015; 114:1702–1710.
33. Adriouch S, Julia C, Kesse-Guyot E, Méjean C, Ducrot P, Péneau S, Donnenfeld M, Deschasaux M, Menai M, Hercberg S, et al. Prospective association between a dietary quality index based on a nutrient profiling system and cardiovascular disease risk. Eur J Prev Cardiol. 2016; 23:1669–76.
34. Julia C, Fézeu LK, Ducrot P, Méjean C, Péneau S, Touvier M, Hercberg S, Kesse-Guyot E. The Nutrient Profile of Foods Consumed Using the British Food Standards Agency Nutrient Profiling System Is Associated with Metabolic Syndrome in the SU.VI.MAX Cohort. J Nutr. 2015 ; 145:2355–61.
35. Julia C, Ducrot P, Lassale C, Fézeu L, Méjean C, Péneau S, Touvier M, Hercberg S, Kesse-Guyot E. Prospective associations between a dietary index based on the British Food Standard Agency nutrient profiling system and 13-year weight gain in the SU.VI.MAX cohort. Prev Med. 2015 ; 81:189–94.
36. Adriouch S, Julia C, Kesse-Guyot E, Ducrot P, Péneau S, Méjean C, Assmann KE, Deschasaux M, Hercberg S, Touvier M, et al. Association between a dietary quality index based on the food standard agency nutrient profiling system and cardiovascular disease risk among French adults. Int J Cardiol. 2017; 234: 22–27.
37. Deschasaux M, Julia C, Kesse-Guyot E, Lécuyer L, Adriouch S, Méjean C, Ducrot P, Péneau S, Latino-Martel P, Fezeu LK, et al. Are self-reported unhealthy food choices associated with an increased risk of breast cancer? Prospective cohort study using the British Food Standards Agency nutrient profiling system. BMJ Open. 2017; 7 (6) : e013718.
38. Gómez-Donoso C, Martínez-González MÁ, Perez-Cornago A, Sayón-Orea C, Martínez JA, Bes-Rastrollo M. Association between the nutrient profile system underpinning the Nutri-Score front-of-pack nutrition label and mortality in the SUN Project : a prospective cohort study. Clin Nutr. 2021; 40 (3):1085-1094.
39. Donat-Vargas C, Sandoval-Insausti H, Rey-García J, Banegas JR, Rodríguez-Artalejo F, Guallar-Castillón P. Five-color Nutri-Score labeling and mortality risk in a nationwide, population-based cohort in Spain: the Study on Nutrition and Cardiovascular Risk in Spain (ENRICA). Am J Clin Nutr. 2021 ; https://doi.org/10.1093/ajcn/nqaa389
40. Bonaccio M, Di Castelnuovo A, Ruggiero E, Costanzo S, Grosso G, De Curtis A, Cerletti C, Donati MB, de Gaetano G, Iacoviello L; Moli-sani Study Investigators. Joint association of food nutritional profile by Nutri-Score front-of-pack label and ultra-processed food intake with mortality: Moli-sani prospective cohort study. BMJ. 2022 Aug 31;378:e070688.
41. Deschasaux M, Huybrechts I, Murphy N, Julia C, Hercberg S, Srour B, Kesse-Guyot E, Latino-Martel P, Biessy C, Casagrande C et al. Nutritional quality of food as represented by the FSAm-NPS nutrient profiling system underlying the Nutri-Score label and cancer risk in Europe: Results from the EPIC prospective cohort study. PLoS Med. 2018; 15(9) : e1002651.
42. Deschasaux M, Huybrechts I, Julia C, Hercberg S, Egnell M, Srour B, Kesse-Guyot E, Latino-Martel P, Biessy C, Casagrande C. Association between nutritional profiles of foods underlying Nutri-Score front-of-pack labels and mortality: EPIC cohort study in 10 European countries. BMJ. 2020 Sep 16;370:m3173. doi: 10.1136/bmj.m3173.
43. Deschasaux-Tanguy, M. Huybrechts, I. Chantal, J. et al. Nutritional quality of diet characterized by the Nutri-Score profiling system and cardiovascular disease risk: a prospective study in 7 European countries, Lancet Reg Health Europe. 2024; 46:101006
44. Franchi, C., Ardoino, I., Orsini, F. et al. Updated nutrient profiling system underlying nutri-score (Uns-Nps) and colorectal cancer risk. Eur J Clin Nutr 79, 635–640 (2025).
45. Egnell M, Seconda L, Neal B, Ni Mhurchu C et al. Prospective associations of the original Food Standards Agency nutrient profiling system and three variants with weight gain, overweight and obesity risk : results from the French NutriNet-Santé cohort. Br J Nutr. 2021 Apr 28;125(8):902-914. doi: 10.1017/S0007114520003384.
46. Rey-García J, Mérida DM, Donat-Vargas C, Sandoval-Insausti H, Rodríguez-Ayala M, Banegas JR, Rodríguez-Artalejo F, Guallar-Castillón P. Less Favorable Nutri-Score Consumption Ratings Are Prospectively Associated with Abdominal Obesity in Older Adults. Nutrients. 2024 Mar 31;16(7):1020. doi: 10.3390/nu16071020. PMID: 38613053; PMCID: PMC11013145.
47. Deng Z, Wawro N, Freuer D, Peters A, Heier M, Meisinger C, Breuninger TA, Linseisen J. Differential association of dietary scores with the risk of type 2 diabetes by metabotype. Eur J Nutr. 2024 Sep;63(6):2137-2148. doi: 10.1007/s00394-024-03411-0. Epub 2024 May 7. PMID: 38714546; PMCID: PMC11377363.
48. Millar SR, Navarro P, Harrington JM, Perry IJ, Phillips CM. The Nutri-Score nutrition label: Associations between the underlying nutritional profile of foods and lipoprotein particle subclass profiles in adults. Atherosclerosis. 2024 Aug;395:117559. doi: 10.1016/j.atherosclerosis.2024.117559. Epub 2024 Apr 20. PMID: 38692976.
49. Meyer A, Dong C, Chan SSM, Touvier M, Julia C, Huybrechts I, Nicolas G, Oldenburg B, Heath AK, Tong TYN, Key TJ, Tjønneland A, Kyrø C, Kaaks R, Katzke VA, Bergman MM, Palli D, Masala G, Tumino R, Sacerdote C, Colorado-Yohar SM, Sánchez MJ, Guevara M, Grip O, Holmgren J, Cross A, Karling P, Hultdin J, Murphy N, Deschasaux-Tanguy M, Hercberg S, Galan P, Mahamat-Saleh Y, Amiot A, Gunter MJ, Boutron-Ruault MC, Carbonnel F. Dietary index based on the Food Standards Agency nutrient profiling system and risk of Crohn’s disease and ulcerative colitis. Aliment Pharmacol Ther. 2024 Feb;59(4):558-568. doi: 10.1111/apt.17835. Epub 2023 Dec 15. PMID: 38100159; PMCID: PMC10952778.
50. Andrianasolo RM, Julia C, Varraso R, Egnell M, Touvier M, Kesse-Guyot E, Hercberg S, Galan P. Association between an individual dietary index based on the British Food Standard Agency Nutrient Profiling System and asthma symptoms. Br J Nutr. 2019 Jul 14;122(1):63-70. doi: 10.1017/S0007114519000655. Epub 2019 Jun 19.
51. Montero-Salazar H, Guallar-Castillón P, Banegas JR, Åkesson A, Rey-García J, Rodríguez-Artalejo F, Donat-Vargas C. Food consumption based on the nutrient profile system underlying the Nutri-Score and renal function in older adults. Clin Nutr. 2022 Jul;41(7):1541-1548.
52. Ducrot P, Mejean C, Julia C, Kesse-Guyot E, Touvier M, Fezeu L, et al. Effectiveness of Front-Of-Pack Nutrition Labels in French Adults: Results from the NutriNet-Sante Cohort Study. PLoS One. 2015; 28 (10) : e0140898.doi : 10.1371/journal.pone.0140898. 33.
53. Julia C, Péneau S, Camille Buscail, Rebeca Gonzalez, Touvier M, Hercberg S, Kesse-Guyot E. Perception of different formats of front-of-pack nutrition labels according to sociodemographic, lifestyle and dietary factors in a French population : cross-sectional study among the NutriNet-Santé cohort participants. BMJ Open. 2017 ; 7(6) : e016108. doi : 10.1136/bmjopen-2017-016108.
54. De Temmerman J, Heeremans E, Slabbinck H, Vermeir I. The impact of the Nutri-Score nutrition label on perceived healthiness and purchase intentions. Appetite. 2021 ; 57 (1) https://doi.org/10.1016/j.appet.2020.104995
55. Sarda B, Julia C, Serry AJ, Ducrot P. Appropriation of the Front-of-Pack Nutrition Label Nutri-Score across the French Population: Evolution of Awareness, Support, and Purchasing Behaviors between 2018 and 2019. 2020; 12(9) : 2887.doi : 10.3390/nu12092887.
56. Hispacoop, Survey on Nutri-Score. 2020 ; https://www.eurocoop.coop/news/281-HISPACOOP-Survey-on-Nutri-Score.html
57. Test Achat. 2020; https://www.test-achats.be/action/espace-presse/communiques-de-presse/2020/peiling-nutri-score
58. BMEL. 2020; https://www.bmel.de/SharedDocs/Downloads/DE/_Ernaehrung/Lebensmittel-Kennzeichnung/Ergebnisbericht_Fokusgruppenbefragung_TeilB_eNWK.pdf? __blob=publicationFile&v=3
59. Egnell M, Talati Z, Hercberg S, Pettigrew S, Julia C. Objective Understanding of Front-of-Package Nutrition Labels: An International Comparative Experimental Study across 12 Countries. Nutrients. 2018, 10: 1542.
60. Egnell M, Talati Z, Galan P, Andreeva V, Vandevijvere S, Gombaud M, Dréano-Trécant L, Hercberg S, Pettigrew S, Julia C. Objective understanding of the Nutri-score front-of-pack label by European consumers and its effect on food choices : an online experimental study. Intern J Behav Nutr Phy Activ. 2020 ; 17:146
61. Ducrot P, Mejean C, Julia C, Kesse-Guyot E, Touvier M, Fezeu LK, et al (2015). Objective Understanding of Front-of-Package Nutrition Labels among Nutritionally At-Risk Individuals. Nutrients. 7 ; 8 : 7106‑25.
62. Packer J, Russell SJ, Ridout D, Hope S, Conolly A, Jessop C, Robinson OJ, Stoffel ST, Viner RM, Croker H. Assessing the Effectiveness of Front of Pack Labels: Findings from an Online Randomised-Controlled Experiment in a Representative British Sample. Nutrients. 2021 Mar 10;13(3):900. doi: 10.3390/nu13030900.
63. Aguenaou, H., El Ammari, L., Bigdeli, M. et al. Comparison of appropriateness of Nutri-Score and other front-of-pack nutrition labels across a group of Moroccan consumers: awareness, understanding and food choices. Arch Public Health 79, 71 (2021). https://doi.org/10.1186/s13690-021-00595-3
64. Kontopoulou, L.; Karpetas, G.; Fradelos, Ε.C.; Papathanasiou, I.V.; Malli, F.; Papagiannis, D.; Mantzaris, D.; Fialon, M.; Julia, C.; Gourgoulianis, K.I. Online Consumer Survey Comparing Different Front-of-Pack Labels in Greece. Nutrients 2022, 14, 46. https://doi.org/10.3390/nu14010046).
65. Kontopoulou L, Karpetas GE, Kotsiou OS, Fradelos EC, Papathanasiou IV, Malli F, Papagiannis D, Mantzaris DC, Julia C, Hercberg S, Galan P, Fialon M, Gourgoulianis KI. Guideline Daily Amounts Versus Nutri-Score Labeling: Perceptions of Greek Consumers About Front-of-Pack Label. Cureus. 2022 Dec 5;14(12):e32198. doi: 10.7759/cureus.32198. PMID: 36620800; PMCID: PMC9811601).
66. Magriplis, E.; Marakis, G.; Panagiotakos, D.B.; Samona, A.; Kotopoulou, S.; Kouretas, D.; Smiliotopoulos, T.; Chourdakis, M.; Zampelas, A. The Relation between Consumer Perception and Objective Understanding of Front-of-Package Nutrition Labels (FOPNLs); Results from an Online Representative Survey. Nutrients 2024, 16, 1751. https://doi.org/10.3390/nu16111751
67. AlQurashi AA, Marar SD, Ayyash M, AlRawi HZ and Abu-Shaheen A. Comparing the influence of front-of-pack nutrition labels on Saudi consumers’ understanding and food selection. Front. Public Health. 2025, 13:1527531. https://www.frontiersin.org/journals/public-health/articles/10.3389/fpubh.2025.1527531/full
68. Mazzù, M. F., Romani, S., & Gambicorti, A. (2020). Effects on consumers’ subjective understanding of a new front-of-pack nutritional label: a study on Italian consumers. International Journal of Food Sciences and Nutrition, 72(3), 357–366. https://doi.org/10.1080/09637486.2020.1796932
69. Mazzù MF, Romani S, Baccelloni A, Gambicorti A. A cross-country experimental study on consumers’ subjective understanding and liking on front-of-pack nutrition labels. Int J Food Sci Nutr. 2021 Sep;72(6):833-847. doi: 10.1080/09637486.2021.1873918. Epub 2021 Mar 3. PMID: 33657942.
70. He, J.; Mazzù, M.F.; Baccelloni, A. A 20-Country Comparative Assessment of the Effectiveness of Nutri-Score vs. NutrInform Battery Front-of-Pack Nutritional Labels on Consumer Subjective Understanding and Liking. Nutrients 2023, 15, 2852. https://doi.org/10.3390/nu15132852.
71 Besancon S, Beran D, Batal M. A study is 21 times more likely to find unfavourable results about the nutrition label Nutri-Score if the authors declare a conflict of interest or the study is funded by the food industry. BMJ Global Health. 2023;8:e011720. https://doi.org/10.1136/bmjgh-2023-011720
72. Vasseur T, Fialon M, Marques-Vidal P, Pereira P, Meirhaeghe A, Galan P, Kesse-Guyot E, Touvier M, Deschasaux-Tanguy M, Sarda B, Hercberg S, Nabec L, Julia C, Comparisons of Nutri-Score and NutrInform Battery on consumer preferences, objective understanding, and food choices among Portuguese consumers, European Journal of Public Health, Volume 35, Issue 4, August 2025, Pages 708–713, https://doi.org/10.1093/eurpub/ckaf089
73. Fialon M, Babio N, Salas-Salvadó J, Galan P, Kesse-Guyot E, Touvier M, Deschasaux-Tanguy M, Sarda B, Hercberg S, Khoury N, Nabec L, Julia C. Comparative understanding and preference of Nutri-Score and NutrInform Battery in a sample of Spanish consumers. Eur J Public Health. 2023 Apr 1;33(2):293-298. doi: 10.1093/eurpub/ckad002. PMID: 36661062; PMCID: PMC10066476.
74. Fialon M, Serafini M, Galan P, Kesse-Guyot E, Touvier M, Deschasaux-Tanguy M, Sarda B, Hercberg S, Nabec L, Julia C. Nutri-Score and NutrInform Battery: Effects on Performance and Preference in Italian Consumers. Nutrients. 2022 Aug 26;14(17):3511. doi: 10.3390/nu14173511. PMID: 36079769; PMCID: PMC9459720.
75. Hoge, A.; Labeye, M.; Donneau, A.-F.; Nekoee, H.Z.; Husson, E.; Guillaume, M. Health Literacy and Its Associations with Understanding and Perception of Front-of-Package Nutrition Labels among Higher Education Students. Int. J. Environ. Res. Public Health 2022, 19, 8751. https://doi.org/10.3390/ijerph19148751
76. Ducrot P, Julia C, Mejean C, Kesse-Guyot E, Touvier M, Fezeu LK, et al. Impact of Different Front-of-Pack Nutrition Labels on Consumer Purchasing Intentions: A Randomized Controlled Trial. Am J Prev Med. 2016 ; 50 : 627‑636.
77. Egnell M, Boutron I, Péneau S, Ducrot P, Touvier M, Galan P, Buscail C, Porcher R, Ravaud P, Hercberg S, Kesse-Guyot E, Julia C. Front-of-Pack Labeling and the Nutritional Quality of Students’ Food Purchases: A 3-Arm Randomized Controlled Trial. Am J Public Health. 2019 ; 109 (8): 1122-1129.
78. Egnell M, Galan P, Fialon M, Touvier M, Péneau S, Kesse-Guyot E, Hercberg S, Julia C. The impact of the Nutri-Score front-of-pack nutrition label on purchasing intentions of unprocessed and processed foods: post-hoc analyses from three randomized controlled trials. Int J Behav Nutr Phys Act. 2021; 18(1) : 38. doi : 10.1186/s12966-021-01108-9.
79. Crosetto P, Muller L, Ruffieux B. Réponses des consommateurs à trois systèmes d’étiquetage nutritionnel face avant Cah. Nutr Diet. 2016 ; 51 (3): 124-131.
80. Crosetto P, Lacroix A, Muller L, Ruffieux B. Modification des achats alimentaires en réponse à cinq logos nutritionnels. Cah Nutr Diet. 2017 ; 52 (3) : 129-133.
81. Crosetto P, Lacroix A, Muller L, Ruffieux B. Nutritional and economic impact of five alternative front-of-pack nutritional labels : experimental evidence. Europ Rev Agric Econ. 2020 ; 47 (2) : 785–818.
82. Ministère des Solidarités et de la Santé. Evaluation ex ante de systemes d’etiquetage nutritionnel graphique simplifierapport final du comite scientifique 2017 ; https://solidarites-sante.gouv.fr/IMG/pdf/rapport_comite_scientifique_etiquetage_nutritionnel_150317.pdf
83. Dubois P, Albuquerque P, Allais O, Bonnet C, Bertail P, Combris P, Lahlou S, Rigal N, Ruffieux B, Chandon P. Effects of front-of-pack labels on the nutritional quality of supermarket food purchases : evidence from a large-scale randomized controlled trial. J. of the Acad. Mark. Sci. 2021; 49 : 119–138
84. Egnell M, Galan P, Fialon M, Touvier M, Péneau S, Kesse-Guyot E, Hercberg S, Julia C. The impact of the Nutri-Score front-of-pack nutrition label on purchasing intentions of unprocessed and processed foods: post-hoc analyses from three randomized controlled trials. Int J Behav Nutr Phys Act. 2021 Mar 17;18(1):38. doi: 10.1186/s12966-021-01108-9. PMID: 33731145; PMCID: PMC7968175.
85. Vandevijvere S, Berger N. The impact of shelf tags with Nutri-Score on consumer purchases: a difference-in-difference analysis of a natural experiment in supermarkets of a major retailer in Belgium. Int J Behav Nutr Phys Act. 2021 Nov 18;18(1):150. doi: 10.1186/s12966-021-01207-7. PMID: 34794474; PMCID: PMC8600100.
86. König, L. M., Akad, E., Gunawan, G., Rocha-González, D. V., & Dorlach, T. (2025, April 1). Nutri-Score and nutrition warning labels are effective in guiding hypothetical choice in Indonesia, Mexico, and Türkiye: Results from a cross-country online experiment. https://doi.org/10.31234/osf.io/vsmjx_v2
87. Ordaz-Castillo ME, Díaz-Díaz PS, Padrón-Monedero A, Revenga-Frauca J, Royo-Bordonada MÁ. Randomised controlled trial on the effect of Chilean nutritional warning labels versus nutri-score in food purchasing intentions. Appetite. 2025 Aug 5;216:108251.
88. Finkelstein EA, Ang FJL, Doble B, Wong WHM, van Dam RM. A Randomized Controlled Trial Evaluating the Relative Effectiveness of the Multiple Traffic Light and Nutri-Score Front of Package Nutrition Labels. Nutrients. 2019 Sep 17;11(9):2236. doi: 10.3390/nu11092236. PMID: 31533256; PMCID: PMC6770629
89. Egnell M, Kesse-Guyot E, Galan P, Touvier M, Rayner M, Jewell J, Breda J, Hercberg S, Julia C. Impact of Front-of-Pack Nutrition Labels on Portion Size Selection : An Experimental Study in a French Cohort. Nutrients. 2018 ; 10 (9): 1268.
90. Jürkenbeck K, Mehlhose C, Zühlsdorf A (2022) The influence of the Nutri-Score on the perceived healthiness of foods labelled with a nutrition claim of sugar. PLoS ONE 17(8): e0272220. https://doi.org/10.1371/journal.pone.0272220
91. Nohlen, H., Bakogianni, I., Grammatikaki, E., Ciriolo, E., Pantazi, M., Alves Dias, J., Salesse, F., Moz Christofoletti, M., Wollgast, J., Bruns, H., Dessart, F.J., Marandola, G. and Van Bavel, R., Front-of-pack nutrition labelling schemes: an update of the evidence, EUR 31153 EN, Publications Office of the European Union, Luxembourg, 2022, ISBN 978-92-76-55032-7, doi:10.2760/932354, JRC130125. https://publications.jrc.ec.europa.eu/repository/handle/JRC130125
92. Commission européenne: Consultation. Étiquetage des denrées alimentaires, révision des règles relatives à l’information des consommateurs. https://ec.europa.eu/info/law/better-regulation/have-your-say/initiatives/12749-Food-labelling-revision-of-rules-on-information-provided-to-consumers/public-consultation_fr
93. Egnell M, Crosetto P, D’Almeida T, Kesse-Guyot E, Touvier M, Ruffieux B, Hercberg S, Muller L., Julia C. Modelling the impact of different front-of-package nutrition labels on mortality from non-communicable chronic disease. Int. J. Behav. Nutr. Phys. Act. 2019 ; 16 : 56.
94. Devaux M, Aldea A, Lerouge A, Vuik S, Cecchini M. Establishing an EU-wide front-of-pack nutrition label: Review of options and model-based evaluation. Obes Rev. 2024 Jun;25(6):e13719. doi: 10.1111/obr.13719. Epub 2024 Feb 7. PMID: 38326224.
95. Courbet, D., Jacquemier, L., Hercberg, S., Touvier, M., Sarda, G., Kesse-Guyot, E., Galan, P., Buttafoghi, N., & Julia C.. A randomized controlled trial to test the effects of displaying the Nutri-Score in food advertising on consumer perceptions and intentions to purchase and consume. Int J Behav Nutr Phys Act, 2024, 21, 38.
96. Sarda B, Kesse-Guyot E, Deschamps V, Ducrot P, Galan P, Hercberg S, Deschasaux-Tanguy M, Srour B, Fezeu LK, Touvier M, Julia C. Complementarity between the updated version of the front-of-pack nutrition label Nutri-Score and the food-processing NOVA classification. Public Health Nutr. 2024 Feb 1;27(1):e63. doi: 10.1017/S1368980024000296. PMID: 38297466; PMCID: PMC10897572.
97. EREN. Nutri-Score et ultra-transformation : deux dimensions différentes, complémentaires et non contradictoires. https://nutriscore.blog/2020/12/07/nutri-score-et-ultra-transformation-deux-dimensions-differentes-complementaires-et-non-contradictoires/
98. Julia C, Baudry J, Fialon M, Hercberg S, Galan P, Srour B, Andreeva VA, Touvier M, Kesse-Guyot E. Respective contribution of ultra-processing and nutritional quality of foods to the overall diet quality: results from the NutriNet-Santé study. Eur J Nutr. 2023 Feb;62(1):157-164. doi: 10.1007/s00394-022-02970-4. Epub 2022 Aug 4. PMID: 35925444.
99. Srour B, Hercberg S, Galan P, Monteiro CA, Szabo de Edelenyi F, Bourhis L, Fialon M, Sarda B, Druesne-Pecollo N, Esseddik Y, Deschasaux-Tanguy M, Julia C, Touvier M. Effect of a new graphically modified Nutri-Score on the objective understanding of foods’ nutrient profile and ultraprocessing: a randomised controlled trial. BMJ Nutr Prev Health. 2023 Jun;6(1):108-118. doi: 10.1136/bmjnph-2022-000599. Epub 2023 Jun 8. PMID: 37484539; PMCID: PMC10359533.
100. EREN. Le Nutri-Score et les autres dimensions santé des aliments (ultra-transformation, résidus de pesticides): informer au mieux les consommateurs. https://nutriscore.blog/2021/11/28/le-nutri-score-et-les-autres-dimensions-sante-des-aliments-informer-au-mieux-les-consommateurs/
101. EREN. Pourquoi Nutri-Score est calculé sur la base de 100g et non par portion (comme demandé par les industriels) ? https://nutriscore.blog/2021/11/03/pourquoi-nutri-score-est-calcule-sur-la-base-de-100g-et-non-par-portion-comme-demande-par-les-industriels/
102. Santé Publique France. https://www.santepubliquefrance.fr/determinants-de-sante/nutrition-et-activite-physique/articles/nutri-score
103. EREN. Pourquoi Danone a décidé de retirer l’affichage du Nutri-Score sur ses marques de yaourts à boire et de boissons végétales ? https://nutriscore.blog/2024/09/13/pourquoi-danone-a-decide-de-retirer-laffichage-du-nutri-score-sur-ses-marques-de-yaourts-a-boire-et-de-boissons-vegetales/
104. Sarda B, Ducrot P, Serry, A J. Nutri Score : Évolution de sa notoriété, sa perception et son impact sur les comportements d’achat déclarés entre 2018 et 2020. Saint Maurice : Santé publique France, novembre 2020. 12 p.
105. Ducrot P, Nugier A, Serry A-J. Nutri-Score : évolution de sa notoriété, sa perception et son impact sur les comportements d’achat déclarés entre 2018 et 2019. Saint Maurice : Santé publique France, septembre 2019. 12 p.
106. Sarda B, Serry AJ, Julia C, Ducrot P. Appropriation of the Front-of-Pack Nutrition Label Nutri-Score across the French Population: Evolution of Awareness, Support, and Purchasing Behaviors between 2018 and 2019. Nutrients. 2020.
107. Ministère de la Santé. Evaluation du logo nutritionnel Nutri-Score pour 2021 https://sante.gouv.fr/IMG/pdf/rapport_nutriscore_bilan_2021_v2.pdf
108. Ministère de la Santé. Evaluation à 3 ans du logo nutritionnel Nutri-Score https://sante.gouv.fr/IMG/pdf/nutriscorebilan3ans.pdf
109. OpinionWay: Le bien manger pout Jow, 2025, https://www.opinion-way.com/wp-content/uploads/2025/05/Etude-JOW-x-OPINION-WAY-BIEN-MANGER.pdf
110. Kantar : Santé, écologie, juste rémunération des producteurs, comment évolue la consommation responsable des Français ? 2024. https://www.kantar.com/fr/inspirations/consommateurs-acheteurs-et-distributeurs/2024-consumergreendaycp
111. Sensia. Nutri-Score : quand Santé, Goût et Durabilité Guident les Consommateurs.2025. https://sensia.ai/fr/blog/nutri-score
112. Scan Up. Nutri-Score : sa présence on-pack et son impact sur la performance des produits. https://scanup.fr/nutri-score-presence-et-impact-performance-2023/
113. Bauner C, Rahman R. The effect of front-of-package nutrition labelling on product composition, European Review of Agricultural Economics, Volume 51, Issue 2, April 2024, Pages 482–505, https://doi.org/10.1093/erae/jbae004
114. UFC Que Choisir. Étude sur l’évolution entre 2015 et 2022 de la qualité nutritionnelle des aliments en lien avec l’adoption du Nutri-Score. https://www.quechoisir.org/action-ufc-que-choisir-nutri-score-seule-une-obligation-de-l-afficher-poussera-les-industriels-de-la-malbouffe-a-ameliorer-leurs-recettes-n107018/
115. Ministère de la santé et de la prévention : Bilan des études pilotes issues des appels à projets de la direction générale de la santé : Application du Nutri-Score en restauration hors foyer. https://sante.gouv.fr/IMG/pdf/bilan_etudes_pilotes_nutri-score_rhf.pdf
116. Julia C, Arnault N, Agaësse C, Fialon M, Deschasaux-Tanguy M, Andreeva VA, Fezeu LK, Kesse-Guyot E, Touvier M, Galan P, Hercberg S. Impact of the Front-of-Pack Label Nutri-Score on the Nutritional Quality of Food Choices in a Quasi-Experimental Trial in Catering. Nutrients. 2021 Dec 17;13(12):4530. doi: 10.3390/nu13124530.
117. Ministère des Solidarités et de la Santé : Programme National Nutrition Santé 2019-2023. https://sante.gouv.fr/IMG/pdf/pnns4_2019-2023.pdf
118. EREN. Un collectif de scientifiques et professionnels de santé, soutenu par de nombreuses associations, appelle le Premier Ministre à rendre le Nutri-Score obligatoire. Il s’agit d’une urgence de santé publique ! https://nutriscore.blog/2024/10/27/un-collectif-de-scientifiques-et-professionnels-de-sante-appelle-le-premier-ministre-a-rendre-le-nutri-score-obligatoire-il-sagit-dune-urgence-de-sante-publique/
120. https://www.ccomptes.fr/fr/publications/la-prevention-et-la-prise-en-charge-de-lobesite
121. https://www.ccomptes.fr/fr/publications/prevention-et-prise-en-charge-precoce-du-diabete
123. EREN. Tribune: des parlementaires (députés et sénateurs) apportent leur soutien à l’appel des scientifiques et professionnels de santé pour la généralisation du Nutri-Score en France. https://nutriscore.blog/2025/07/05/tribune-des-parlementaires-deputes-et-senateurs-apportent-leur-soutien-a-lappel-des-scientifiques-et-professionnels-de-sante-pour-la-generalisation-du-nutri-score-en-france/
124. Commission européenne. Communication de la commission au parlement européen, au conseil, au comité économique et social européen et au comité des régions, Une stratégie « De la ferme à la table »pour un système alimentaire équitable, sain et respectueux de l’environnement, 2020, https://eur-lex.europa.eu/legal-content/FR/TXT/HTML/?uri=CELEX:52020DC0381
125. European Public Health Association. Statement on front-of-pack nutrition labelling in the European Union, 2023, https://eupha.org/repository/advocacy/2023/EUPHA%20Statement%20on%20FoPNL%20FINAL.pdf
126. Hercberg S, Garde A, Julia C, Touvier M, Galan P. Alimentation et santé : pourquoi l’Europe doit adopter le logo Nutri-score. The Conversation, 2023, https://theconversation.com/alimentation-et-sante-pourquoi-leurope-doit-adopter-le-logo-nutri-score-206909
127. EREN. Face à la science, les politiciens italiens font appel au « gastro-nationalisme » pour bloquer Nutri-Score en Europe. Une enquête de Mediapart. https://nutriscore.blog/2023/12/04/face-a-la-science-les-politiciens-italiens-font-appel-au-gastro-nationalisme-pour-bloquer-nutri-score-en-europe-une-enquete-de-mediapart/
128. https://x.com/amaravati_today/status/1895808289692401975)
128 EREN. Nutri-Score : même avec un signe de qualité ou d’origine (AOC/AOP, IGP, Bio, Label Rouge…), un produit gras, sucré ou salé reste un produit gras, sucré ou salé ! https://nutriscore.blog/2021/06/17/nutri-score-meme-avec-un-signe-de-qualite-ou-dorigine-aoc-aop-igp-bio-label-rouge-un-produit-gras-sucre-ou-sale-reste-un-produit-gras-sucre-ou-sale/
130. UFC Que Choisir : Le Nutri-Score, meilleure illustration de la qualité nutritionnelle de notre patrimoine culinaire ! https://www.quechoisir.org/action-ufc-que-choisir-enquete-de-l-ufc-que-choisir-sur-les-aliments-traditionnels-le-nutri-score-meilleure-illustration-de-la-qualite-nutritionnelle-de-notre-patrimoine-culinaire-n100652/
131. Vlassopoulos, A.; Katidi, A.; Savvidou, T.; Kapsokefalou, M. Alignment of Nutri-Score with Mediterranean Diet Pyramid: A Food Level Analysis. Nutrients 2022, 14, 5097. https://doi.org/10.3390/nu14235097
132. Trichopoulou A, Costacou T, Bamia C, Trichopoulos D. Adherence to a Mediterranean Diet and Survival in a Greek Population. N Engl J Med 2003; 348: 26, 2599-2608.
133. The Scientific Committee of the Nutri-Score. Update of the Nutri-Score algorithm. Update report from the Scientific Committee of the Nutri-Score.2022 https://sante.gouv.fr/IMG/pdf/maj__rapport_nutri-score_rapport__algorithme_2022_.pdf
134. The Scientific Committee of the Nutri-Score. Update of the Nutri-Score algorithm for beverages. Second update report from the Scientific Committee of the Nutri-Score V2-2023. https://www.santepubliquefrance.fr/determinants-de-sante/nutrition-et-activite-physique/documents/rapport-synthese/update-of-the-nutri-score-algorithm-for-beverages.-second-update-report-from-the-scientific-committee-of-the-nutri-score-v2-2023
135. Merz B, Temme E, Alexiou H, Beulens JWJ, Buyken AE, Bohn T, Ducrot P, Falquet MN, Solano MG, Haidar H, Infanger E, Kühnelt C, Rodríguez-Artalejo F, Sarda B, Steenbergen E, Vandevijvere S, Julia C. Nutri-Score 2023 update. Nat Food. 2024 Feb;5(2):102-110. doi: 10.1038/s43016-024-00920-3. Epub 2024 Feb 14. PMID: 38356074.
136. EREN blog . Pour la Ministre de l’Agriculture, les aliments qu’elle considère «remarquables» ne doivent pas être mal classés par le Nutri-Score ! Debunking… https://nutriscore.blog/2025/03/06/pour-la-ministre-de-lagriculture-les-aliments-quelle-considere-remarquables-ne-doivent-pas-etre-mal-classes-par-le-nutri-score-debunking/
Authors:
Serge Hercberg, Pilar Galan, Chantal Julia, Aline Aline Meirhaeghe,
Mélanie Deschasaux-Tanguy, Emmanuelle Kesse-Guyot, Bernard Srour, Leopold Fezeu, Cedric Agaesse, Sandrine Peneau, Jérémy Vanhelst, Alice Bellicha, Paola Yvroud, Charlotte Verdot, Benjamin Allès, Julia Baudry, Valentina Andreeva, Mathilde Touvier
Nutritional Epidemiology Research Team
U1153 Inserm/Inrae/CNAM/Sorbonne Paris Nord University (Bobigny)
