
Galan P, Kesse-Guyot E, Touvier M, Deschasaux M, Srour B, Chazelas E, Baudry J, Fialon M,
Julia C, Hercberg S1
A campaign led by opponents of Nutri-Score in various media and on social networks aims to discredit this front-of pack labeling system by suggesting that Nutri-Score could be a source of confusion for consumers. Their argument is that Nutri-Score classifies ultra-processed foods in A and B, while high consumption of ultra-processed foods has been associated with increased health risks.
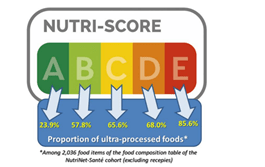
Most often, they repeatedely rely on a figure from a paper we published in 2018 in the BMJ (1) showing the percentage of ultra-processed products (defined as classified 4 by the NOVA classification) in each Nutri-Score class.
Simultaneously, pictures of ultra-processed foods classified in Nutri-Score as A or B alongside raw or processed foods classified D or E (often the same pictures of breakfast cereals classified B vs. cheese classified D) circulate on social networks and in the media with negative comments suggesting that Nutri-Score “whitewashes” ultra-processed foods by ranking them advantageously in order “to favour products from the agri-food industries”, some even claiming that Nutri-Score is financed by manufacturers!… It is really outrageous when retracing the history of the Nutri-Score since it was proposed in 2014, and the difficulties that public health actors have encountered in convincing manufacturers to accept transparency for consumers by adopting it (2-5) ( many companies still oppose the Nutri-Score).

Scientific fact-based elements of response:
1. Limitations in the interpretation of the figure showing the percentage of ultra-processed foods by Nutri-Score classes. What is the reality?
This figure originating from one of our scientific articles, disseminated by opponents on social media, is in fact based on the analysis of a nutritional composition table of 2,036 foods used in our research programs developed within the NutriNet-Santé cohort and that is adapted to the food surveys conducted therein. This nutritional composition table includes generic foods that provide only a partial picture of the variability and quantity of food products available at the point of purchase. As a result, the foods in the generic table are not necessarily a ‘representative’ reflection of the overall food supply in stores, as they are rather adapted to the usually consumed products recorded by the NutriNet-Santé study participants. Thus, rather than using the original figure, which is unsuitable for analysing whether Nutri-Score is ‘favourable’ to ultra-processed products on the market, it is more interesting to look at how ultra-processed foods available on the food market in France are classified into the Nutri-Score classes. In an analysis of 220,522 ultra-processed foods (classified as NOVA 4) from the Open Food Facts France (2020) database of French food products, we found that 79% of ultra-processed foods are classified as C, D and E, while 8% are in A and 13% in B (6). The highlighted examples of ultra-processed products classified Nutri-Score A therefore seem to come from a minority of specific products compared to a large majority that are unfavourably classified by Nutri-Score.

2. Nutri-Score and ultra-processing: two different and complementary dimensions
Finding certain ultra-processed foods « well » classified by Nutri-Score is not surprising considering that the Nutri-Score and the NOVA classification do not cover the same “health dimensions” of foods, and this should by no means lead to the conclusion that the two concepts are in conflict. Nutri-Score is a Front-of-Pack nutritional label that characterizes the nutritional composition of foods. It does not contradict the concept of food processing evaluated in this work by the NOVA classification. It only reflects the fact that nutritional quality and ultra-processing are two different characteristics of foods that can each affect health through specific mechanisms.
When assessing the value of a nutritional label such as Nutri-Score, it is essential to consider the overall purpose of nutrition labels by considering their objectives, interests and limitations. It should be kept in mind that, by definition, Nutri-Score, like all nutritional labels, does not cover all the health dimensions of foods (nutritional quality, degree of transformation, presence of pesticides, etc.). No label can encompass in a single indicator all these dimensions which may diverge for a given food due to their different nature. Nutri-Score therefore informs only about the nutritional dimension of foods allowing consumers to easily compare between foods . However, it is important to remember that Nutri-Score has the advantage of taking into account, from a nutritional point of view, a large number of elements recognized, with a high level of scientific evidence, as having an impact (negative or positive) on health, in particular the content per 100g of food of: calories, sugar, salt, saturated fats, fibre, fruits and vegetables (proxy of antioxidant vitamins and minerals content), legumes, and olive, rapeseed and nuts oils and proteins (proxy of calcium and iron content, etc.).
Each of the nutritional elements taken into account in the calculation of the Nutri-Score therefore has a solid scientific justification, and the aggregation of these components within its overall algorithm has been the subject of numerous validation works. Multiple studies conducted on large cohorts in France (7-12), Spain (13) and many other European countries (14.15) (with tens or even hundreds of thousands of people followed over several years) have consistently found that the consumption of foods with less favourable rating in the Nutri-Score scale was prospectively associated, at the individual level, with an increased risk of chronic disease and mortality. This validation of the algorithm underlying the calculation of the Nutri-Score in cohorts is a strong demonstration of the relevance and reliability of this algorithm in terms of the choice of the elements incorporated in its calculation and the allocation of points to the different components. This validation of the algorithm is of the utmost importance as it is complementary to the numerous studies (16-25) that have shown that the graphical format of Nutri-Score was particularly well perceived and understood by consumers and had a favourable impact on the nutritional quality of food purchases (especially in more disadvantaged populations).
While it takes into account many nutritional components, it is clear that Nutri-Score and its algorithm do not integrate the other dimensions of foods that could affect health such as the degree of processing, the presence of additives (artificial colourings, preservatives, emulsifiers, flavour enhancers, sweeteners, etc.), neo-formed compounds during processing (acrylamide, nitrosamines, furans, etc.), substances migrating from packaging, pesticides (insecticides, fungicides and herbicides), antibiotics, or other environmental contaminants (dioxins, heavy metals).
The fact that only the nutritional composition of foods is included in Nutri-Score is explained by the impossibility, in the current state of scientific knowledge, to develop a synthetic indicator covering all the different health dimensions of foods. The methodological questions are numerous: what are the real health impacts of the various “non-nutritional” factors, what risks are attributable to each of these dimensions, what exactly are the components to be incriminated, is a cocktail effect possible… While levels of evidence are currently very high and robust in terms of the impact of nutritional factors (salt, sugar, fibre, fruits and vegetables, etc.) on health, data on all non-nutritional factors are lacking. Research is underway, but at this time, it is not possible to determine how to weight the relative contribution of each of the dimensions of a food on the health risk (some may even be conflicting), to provide a synthetic score that would ideally be predictive of an overall health risk level. The apps that offer it exceed the level of current scientific knowledge, and are therefore misleading to the consumer.
But if the Nutri-Score refers only to a nutritional information system, this already represents a lot in terms of public health (as demonstrated by numerous scientific studies showing its favourable effect on consumer choice and its expected impact on morbidity and mortality), which fully justifies its implementation. As it does not claim to be an information system on the overall health dimension of food (no more than any other front-of-pack nutrition labels), it should be complemented by specific information on the other health dimensions of food, in particular those corresponding to the processing/formulation of the food product or the fact of being from organic farming.
3. All foods, whether ultra-processed, processed or unprocessed, are not equivalent in terms of nutritional quality, hence the interest of Nutri-Score
While covering different dimensions, there is nevertheless an overall association between the degree of processing and the nutritional quality of foods.
Table 1 shows that in the Open Food Facts database, the FSA-NPS score underlying the Nutri-Score (lower scores corresponding to higher nutritional quality and conversely) is on average lower for unprocessed or minimally processed foods (NOVA1), while ultra-processed foods (NOVA4) have the lowest average nutritional quality (corresponding to foods with less favourable rating in the Nutri-Score scale)). Processed foods (NOVA3) are in an intermediate position in terms of nutritional quality.
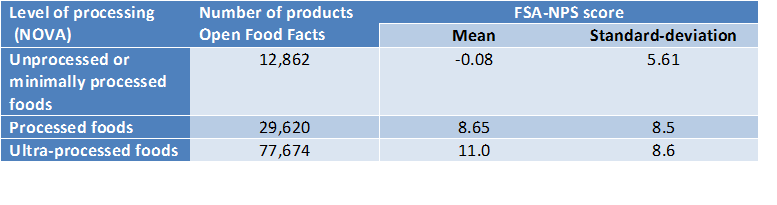
D Despite the overall consistency between ultra-processed food and lower nutritional quality assessed by the FSA-NPS score underlying the calculation of the Nutri-Score, it is absolutely not surprising that some ultra-processed foods are well classified by Nutri-Score: the analysis cited above concerning 220,522 ultra-processed foods (NOVA 4) from the Open Food Facts database (2020) shows that while 79% of ultra-processed foods are classified as C, D and E, 8% ranks A and 13% B.
This is related to the fact that these two concepts do not cover the same dimensions. These dimensions are not collinear but are complementary.
But a major point to consider is that within ultra-processed foods (NOVA4) there are significant differences in terms of composition, not only in the number, type and doses of additives, but also in terms of overall nutritional quality. For example, an industrial prepared dish considered to be ultra-processed, such as « petit salé aux lentilles » (salted pork with lentils), contains additives in all cases. But out of eleven different brands found in Open Food Facts, six rank Nutri-Score A; three Nutri-Score B and two Nutri-Score C. This is true for multiple ultra-processed foods. Nutri-Score therefore allows within the broad category of ultra-processed products to differentiate their nutritional quality, which is essential in terms of impact on health.
In the same area, there are also significant differences in terms of nutritional quality within the other NOVA categories. Even among unprocessed or minimally processed foods (NOVA1), while 54.4% are classified Nutri-Score A and 15.7% B, 19.2% are classified C and even 7.4% and 3.3% are respectively classified D and E (fruit juices for example). Nutri-Score also highlights differences in nutritional quality within NOVA3 processed foods(A: 16.7%, B: 14.3%; C: 20.2%; D: 32.5%; E: 16.3%).
Finally, a number of culinary ingredients (classified as NOVA2), such as sugar, salt, oil or butter, are not classified as processed or ultra-processed foods (due to their small number of processing steps and the fact that they do not contain «cosmetic» additives), but they are still of limited nutritional interest (unfavourable nutritional composition) and many are also classified with unfavourable Nutri-Score. In addition, for added fats, the classification according to the degree of processing ranks all vegetal oils equivalently as NOVA2, which makes it impossible to distinguish between vegetable oils and to highlight those whose nutritional composition is the most favourable and therefore that should be preferred in terms of health, such as olive oil or rapeseed oil in comparison with other oils (sunflower, corn, peanut, coconut, etc.). Nutri-Score discriminates between these different oils with grades from C to E, thus helping consumers to recognize the most favourable oils in terms of health.
4. Relevance of Nutri-Score to guide consumer choices in addition to general recommendations concerning unprocessed and ultra-processed foods. Key takeouts from research…
Current public health recommendations in France and in many countries recommend1) to consume foods with higher nutritional quality and 2) to consume preferably unprocessed or minimally-processed foods and to limit the consumption of ultra-processed foods.
Nutri-Score helps consumers to compare, in a simple, intuitive and understandable way, the nutritional quality of foods within the same category, between different categories (when relevant to be compared in terms of purchase, use or time of consumption) or, for the same food, between different brands.
Several prospective epidemiological studies, including those performed in the NutriNet-Santé cohort (25-28), have shown an association between the consumption of ultra-processed foods (NOVA4) and the risk of chronic diseases (regardless of nutritional quality).
On the other hand, other prospective epidemiological studies in different cohorts (SU.VI.MAX, NutriNet-Santé, EPIC (7-15)) have also shown an association, at the individual level, between the algorithm underpinning the Nutri-Score at the dietary level and risk of chronic disease (independently to the level of processing/ultra-processing, as verified for example in the NutriNet-Santé cohort where associations between the dietary index underlying Nutri-Score and the risk of breast cancer were still significant after adjustment on the share of ultra-processed foods in the diet: 870 cases/345,606 person-years, HR Q5 vs Q1 =1.35 (1.06-1.73), P-trend=0.02 without adjustment; HR Q5 vs Q1 =1.37 (1.07-1.76), P-trend= 0.02 with adjustment).
Concerning the analysis of food consumption patterns, different models of decomposition illustrate that the dimensions « ultra-processed foods » and « Nutri-Score » are different and complementary. Thus, if we look at the difference in nutritional quality between people with a more favourable « Nutri-Score » food pattern and people with a less favourable « Nutri-Score » food pattern, we can calculate: 1) the share of the nutritional quality difference of Nutri-Score between food groups: for example selecting sugary drinks compared to fruits, and 2) the share of the nutritional quality related to the ultra-processed foods (%NOVA4) for a given food category: for example, choose a NOVA 4 drink vs a fresh fruit juice ;
Thus with a difference in nutritional quality of 68% between people with a « Nutri-Score more favourable » food model and people with a « Nutri-Score less favourable » food model :
– 32% is due to differences in nutritional quality between food groups
– 22% is due to the choice of ultra-processed foods in a given food group.
Thus, if these components are linked, we can see that the role of the nutritional component (not related with ultra-processed foods) is still important.
Finally,
Based on available scientific data, from a public health viewpoint, if recommendations promote the consumption of unprocessed foods and the reduction of the consumption of ultra-processed foods, Nutri-Score appears to be a particularly useful tool to orient consumers choices towards foods of higher nutritional quality regardless of their level of processing. Whether they are unprocessed, processed or ultra-processed, foods have significant differences in terms of nutritional quality. As demonstrated by numerous scientific studies, including studies carried out in virtual supermarkets and in real conditions (in experimental stores and supermarkets in real-life), Nutri-Score is efficient (and its efficacy is superior compared to all other front-of-pack nutrition labels) for the general population and it is particularly well understood and efficient in vulnerable populations, in particular underprivileged populations of low social economic level, those with the lowest level of knowledge in nutrition and at-risk groups (students, patients with chronic diseases, etc.).
Regardless of the level of food processing, it has been shown that consuming foods that are ranked better on the Nutri-Score scale correspond to a real nutritional and health benefit, as it is associated with a lower risk of chronic diseases. This is important because even if we recommend to reduce the consumption of ultra-processed foods, for those who do not want or cannot avoid it or for whom it is difficult to cook (for reasons of time, facility, taste, etc.), the choice of a food better ranked on the Nutri-Score scale has a positive impact on health. The recommendation is clear: it is better to eat a homemade meal than an ultra-processed one, but for the consumer who does not want or cannot do it and wants to choose an ultra-processed meal, there is a definite advantage of consuming the dishes best ranked on the Nutri-Score scale and if he still chooses a poorly classified dish (D or E), the Nutri-Score reminds him that it is better to consume them in smaller quantities and less frequently.
We need, of course, a communication strategy adapted to help consumers use the Nutri-Score, while at the same time encouraging the reduction of ultra-processed foods (with clear messages and the possibility of identifying ultra-processed foods for the consumer with possibly an appropriate specific label indicating if the food is ultra-processed). Even if we must continue to recommend limiting the consumption of these foods, they are present in supermarket shelves (they are not prohibited). Since there is a high degree of nutritional variability within these product groups, it is interesting for the consumer to consider Nutri-Score. Finally, it should be kept in mind that certain groups of processed but not ultra-processed foods (such as cured meats) or unprocessed foods (such as fruit juices) or considered as culinary ingredients (such as butter, sugar, salt), have an unfavourable nutritional composition that Nutri-Score is able to reveal and allow consumers to alert them to the fact that their consumption should be limited in quantity and frequency.
The health issue raised by ultra-processed foods should not overshadow the nutritional quality of foods which remains of paramount importance and for which the level of scientific evidence is currently the highest. But public health action must combine measures to both, reduce the consumption of ultra-processed foods and to choose, whatever their level of processing, foods with the best Nutri-Score (and reduce the amounts of those who have a lower Nutri-Score).
In practice, in order of levels of evidence and current scientific knowledge:
• It is important to remember that the highest level of evidence in terms of impact on health concerns nutritional aspects (limit sugar, salt, promote fiber, fruits and vegetables, legumes, etc.). So the first reflex for consumers must be, for pre-packaged foods, to use the Nutri-Score logo as an indicator of the overall nutritional quality of the food.
• In parallel, given the recent studies (including from our scientific team) suggesting higher health risks associated with the consumption of ultra-processed foods, and while looking forward to scientific work providing more information on their real impact and which are the compounds and mechanisms involved (additive cocktails, neoformed compounds, etc.), it is important to favour consumption of unprocessed or minimally processed foods and foods with no or few additives (easily identifiable in the list of ingredients).
• Similarly, as a precautionary principle while waiting for more scientific information on the impact of pesticide residues as consumed in our current diet, it is advisable to favour foods from production methods limiting inputs such as organic agriculture (specific label « organic food »).
REFERENCES
1. Srour B, Fezeu LK, Kesse-Guyot E, Allès B, Méjean C, Andrianasolo RM, et al. Ultra-processed food intake and risk of cardiovascular disease: prospective cohort study (NutriNet-Santé). BMJ. 2019 29;365:l1451.
2. Julia C, Hercberg S. Research and lobbying conflicting on the issue of a front-of-pack nutrition labelling in France. Arch Public Health. 2016 Nov 28;74:51.
3. Julia C, Charpak Y, Rusch E, Lecomte F, Lombrail P, Hercberg S. Promoting public health in nutrition : Nutri-Score and the tug of war between public health and the food industry. Eur J Public Health. 2018 Jun 1;28(3):396-397.
4. Mialon M, Julia C, Hercberg S. The policy dystopia model adapted to the food industry : the example of the Nutri-Score saga in France. World Nutrition 9, no 2 (2018) : 109 20.
5. Julia C, Hercberg S. Big Food’s Opposition to the French Nutri-Score Front-of-Pack Labeling Warrants a Global Reaction. Am J Public Health. 2018 Mar;108(3):318-320.
6. Hercberg S. From nutritional research to public health measures Nutri-Score: past, present and future. XI Symposium CIBER Fisiopatología de la Obesidad y Nutrición, 26 -29 octobre 2020, Madrid, Spain
7. Adriouch S, Julia C, Kesse-Guyot E, Ducrot P, Péneau S, Méjean C, Assmann KE, Deschasaux M, Hercberg S, Touvier M, et al. Association between a dietary quality index based on the food standard agency nutrient profiling system and cardiovascular disease risk among French adults. Int J Cardiol. 2017;234:22–7.
8. Adriouch S, Julia C, Kesse-Guyot E, Méjean C, Ducrot P, Péneau S, Donnenfeld M, Deschasaux M, Menai M, Hercberg S, et al. Prospective association between a dietary quality index based on a nutrient profiling system and cardiovascular disease risk. Eur J Prev Cardiol. 2016;23:1669–76.
9. Julia C, Fézeu LK, Ducrot P, Méjean C, Péneau S, Touvier M, Hercberg S, Kesse-Guyot E. The Nutrient Profile of Foods Consumed Using the British Food Standards Agency Nutrient Profiling System Is Associated with Metabolic Syndrome in the SU.VI.MAX Cohort. J Nutr. 2015;145:2355–61.
10. Donnenfeld M, Julia C, Kesse-Guyot E, Méjean C, Ducrot P, Péneau S, Deschasaux M, Latino-Martel P, Fezeu L, Hercberg S, et al. Prospective association between cancer risk and an individual dietary index based on the British Food Standards Agency Nutrient Profiling System. Br J Nutr. 2015;114:1702–10.
11. Deschasaux M, Julia C, Kesse-Guyot E, Lécuyer L, Adriouch S, Méjean C, Ducrot P, Péneau S, Latino-Martel P, Fezeu LK, et al. Are self-reported unhealthy food choices associated with an increased risk of breast cancer? Prospective cohort study using the British Food Standards Agency nutrient profiling system. BMJ Open. 2017;7:e013718.
12. Julia C, Ducrot P, Lassale C, Fézeu L, Méjean C, Péneau S, Touvier M, Hercberg S, Kesse-Guyot E. Prospective associations between a dietary index based on the British Food Standard Agency nutrient profiling system and 13-year weight gain in the SU.VI.MAX cohort. Prev Med. 2015;81:189–94.
13. Gómez-Dono so C, Martínez-González MÁ, Perez-Cornago A, Sayón-Orea C, Martínez JA, Bes-Rastrollo M. Association between the nutrient profile system underpinning the Nutri-Score front-of-pack nutrition label and mortality in the SUN Project : a prospective cohort study. Clin Nutr. 2020 Jul 17:S0261-5614(20)30359-9
14. Deschasaux M, Huybrechts I, Murphy N, Julia C, Hercberg S, Srour B, Kesse-Guyot E, Latino-Martel P, Biessy C, Casagrande C, et al. Nutritional quality of food as represented by the FSAm-NPS nutrient profiling system underlying the Nutri-Score label and cancer risk in Europe: Results from the EPIC prospective cohort study. PLoS Med. 2018 Sep 18;15(9):e1002651
15. Deschasaux M, Huybrechts I, Julia C, Hercberg S, Egnell M, Srour B, Kesse-Guyot E, Latino-Martel P, Biessy C, Casagrande Association between nutritional profiles of foods underlying Nutri-Score front-of-pack labels and mortality: EPIC cohort study in 10 European countries. BMJ. 2020 Sep 16;370:m3173.
16. Ducrot P, Mejean C, Julia C, Kesse-Guyot E, Touvier M, Fezeu L, et al. Effectiveness of Front-Of-Pack Nutrition Labels in French Adults: Results from the NutriNet-Sante Cohort Study. PLoSOne. 2015;10:e0140898-.
17. Ducrot P, Mejean C, Julia C, Kesse-Guyot E, Touvier M, Fezeu LK, et al. Objective Understanding of Front-of-Package Nutrition Labels among Nutritionally At-Risk Individuals. Nutrients. 24 août 2015;7:7106‑25.
18. Ducrot P, Julia C, Mejean C, Kesse-Guyot E, Touvier M, Fezeu LK, et al. Impact of Different Front-of-Pack Nutrition Labels on Consumer Purchasing Intentions: A Randomized Controlled Trial. AmJPrevMed. mai 2016;50:627‑36.
19. Julia C, Blanchet O, Mejean C, Peneau S, Ducrot P, Alles B, et al. Impact of the front-of-pack 5-colour nutrition label (5-CNL) on the nutritional quality of purchases: an experimental study. Int J Behav Nutr Phys Act. 20 sept 2016;13:101-.
20. Dubois P, Albuquerque P, Allais O, Bonnet D, Bertail P, Combris P, Lahlou S, Rigal N, Ruffieux B, Chandon P. Effects of front-of-pack labels on the nutritional quality of supermarket food purchases : evidence from a large-scale randomized controlled trial. Journal of the Academy of Marketing Science 2020
21. Crosetto P, Lacroix A, Muller L, Ruffieux B. Nutritional and economic impact of five alternative front-of-pack nutritional labels : experimental evidence. European Review of Agricultural Economics, 47, 2, April 2020, 785–818,
22. Egnell M, Talati Z, Hercberg S, Pettigrew S, Julia C. Objective Understanding of Front-of-Package Nutrition Labels: An International Comparative Experimental Study across 12 Countries. Nutrients. 2018;10:1542.
23. Egnell P, Ducrot M, Touvier B., Allès S, Hercberg E, Kesse-Guyot C, Julia C. Objective understanding of Nutri-Score Front-Of-Package nutrition label according to individual characteristics of subjects: Comparisons with other format labels. PLoS ONE. 2018; 23 (13): e0202095.
24. Egnell M, Boutron I, Péneau S, Ducrot P, Touvier M, Galan P, Buscail C, Porcher R, Ravaud P, Hercberg S, Kesse-Guyot E, Julia C. Front-of-Pack Labeling and the Nutritional Quality of Students’ Food Purchases: A 3-Arm Randomized Controlled Trial. Am J Public Health. 2019 Aug;109(8):1122-1129.
25. Fiolet T, Srour B, Sellem L, Kesse-Guyot E, Allès B, Méjean C, Deschasaux M, Fassier P, Latino-Martel P, Beslay M, Hercberg S, Lavalette C, Monteiro CA, Julia C, Touvier M. Consumption of ultra-processed foods and cancer risk: results from NutriNet-Santé prospective cohort. BMJ. 2018;360:k322.
26. Schnabel L, Kesse-Guyot E, Alles B, et al. Association Between Ultraprocessed Food Consumption and Risk of Mortality Among Middle-aged Adults in France. JAMA Intern Med. February 2019. doi:10.1001/jamainternmed.2018.7289
27. Srour B, Fezeu LK, Kesse-Guyot E, Allès B, Méjean C, Andrianasolo RM, Chazelas E, Deschasaux M, Hercberg S, Galan P, Monteiro CA, Julia C, Touvier M.. Ultra-processed food intake and risk of cardiovascular disease: prospective cohort study (NutriNet-Santé). BMJ. 2019 May 29;365:l1451
28. Srour B, Fezeu LK, Kesse-Guyot E, Allès B, Debras C, Druesne-Pecollo N, Chazelas E, Deschasaux M, Hercberg S, Galan P, Monteiro CA, Julia C, Touvier M. Ultraprocessed Food Consumption and Risk of Type 2 Diabetes Among Participants of the NutriNet-Santé Prospective Cohort. JAMA Intern Med. 2020 Feb 1;180(2):283-291
==========================
1 Université Sorbonne Paris Nord. Equipe de Recherche en Epidémiologie Nutritionnelle U1153 (Institut National de la Santé et de la Recherche Médicale/Institut National de la Recherche Agronomique/CNAM/Université Sorbonne Paris Nord), Bobigny, France.
Unité de Nutrition et Santé Publique, Dép. de Santé Publique, Hôpital Avicenne, Bobigny, France.
