
Fabien Szabo de Edelenyi1, Manon Egnell1, Pilar Galan1, Serge Hercberg1,2, Chantal Julia1,2
This report describes the ability of the Front-of-Pack nutrition Label (FoPL), namely the Nutri-Score, to discriminate the nutritional quality of pre-packed food products available in the markets of 13 different European countries and its consistency with global nutritional recommendations. It complements specific analysis previously published in scientific peer-reviews journals using the same methodology concerning the French [1] and the German food markets [2].
Material and methods
Data was retrieved from the Open Food Facts project database, a collaborative web project gathering food composition data based on available back-of-pack labeling of products. Data is collected by volunteer contributors and includes information about ingredients and nutrition facts from food products purchased in stores, effectively using crowdsourcing to collect food composition data of the food supply. The collected data is available freely as an open data source and can be downloaded for research purposes.
Food composition table
As the items in the database are collected from stores, foods and beverages included are exclusively manufactured pre-packaged foods. As the single identifier for a given food is the barcode of the food, identical products sold with various packagings (in different amounts mainly) may appear multiple times in the database. The open Food Facts database contains data from national brands, store brands and discount brands, and is available around the world.
Depending on the number of contributors in a given country, the number of products in the database may vary.For this report, we selected only the 13 Europeans countries with more than 1000 products available (Austria, Belgium, Finland, France, Germany, Italy, Netherlands, Poland, Portugal, Spain, Sweden, Switzerland and United Kingdom).
Food classification
Foods were categorized using a consumer’s point of view, grouping foods with similar use and distinct nutritional characteristics. Main food groups included ‘Products containing mainly fruits and vegetables’, ‘Cereals and potatoes’, ‘Meat, Fish and Eggs’, ‘Milk and dairy products’, ‘Fats and sauces’, ‘Composite foods’, ‘Sugary snacks’, ‘Salty snacks’ and ‘Beverages’. Within each food group, sub-groups were identified (e.g. in the ‘Cereals and potatoes’, subcategories included ‘Bread’, ‘Cereals’, ‘Legumes’, ‘Potatoes’ and ‘Breakfast cereals’). Each food was categorized in a single food group and sub-group. Herbs and spices, or special use products were excluded from the database, as they are not included in the perimeter of the Nutri-Score application. The number of products available in each group or sub-group varied depending on the country. To avoid misleading representation due to a small number of items, only food groups for which more than 20 foods were available were shown in the graphics. Foods with an incomplete nutritional composition for the Nutri-Score computation were excluded, as well as foods with missing group labelling.
Analyses
FSA score computation
The Nutri-Score relies on the computation of a nutrient profiling system, originally developed in the United Kingdom by the Food Standards Agency (FSA) for the regulation of advertising to children [3-5]. It was adapted for the purpose of nutritional labelling in France by the High Council for Public health, with the goal of ensuring a high degree of alignment between the scoring system and the French nutritional recommendations [6-7]. For each product, the FSA score modified by the Health Council of Public Health (FSAm-NSP) was computed taking into account nutrient content for 100 g. The FSAm-NSP score allocates positive points (0-10) for content in energy (KJ), total sugars (g), saturated fatty acids (g) and sodium (mg). Negative points (0-5) are allocated to content in fruits, vegetables and nuts (%), fibers (g) and proteins (g). Final score, calculated as a combination of the positive and the negative points, is based on a discrete continuous scale ranging theoretically from -15 (higher nutritional quality) to +40 points (lower nutritional quality). Specific thresholds to attribute points in the different components are used for generic foods, cheese, beverages and fats and oils. Then, cut-off are applied in order to obtain the corresponding Nutri-Score: A below -1 point (in dark green), B from 0 to 2 points (green), C from 3 to 10 points (yellow), D from 11 to 18 points (orange) and E from 19 points and over (dark orange). For beverages, the thresholds were adapted, as follow: A only applied to water, B up to 1 point (green), C from 2 to 5 (yellow), D from 6 to 9 (orange) and E from 10 points and over (dark orange).
Statistical analyses
The distribution of the overall FSAm-NSP score was computed in the different food groups, and displayed using a boxplot, highlighting the median, 25th and 75th percentiles of the distribution. Distribution of foods and beverages in the different categories of the Nutri-Score were computed. Ability of the FoPL to discriminate nutritional quality of foods and beverages was estimated by the number of available colors in each group and sub-groups. When three or more colors were available in a food group, the discriminating ability of the Nutri-Score was considered good, in a pragmatic approach.
Page break
Results for Austria
For Austria, the OpenFoodFact table included 5246 foods. From this list, 2924 products could not be affected to a specific food group and were deleted from the list. Then, 289 products were removed because the nutritional informations necessary to the calculation of the NutriScore were missing. 2 products were deleted after additionnal quality controls. Finally, the OpenFoodFact table used for this document included 2031 foods. The database contained 105 products composed mainly of fruits and vegetables, 353 bread and cereal products, 152 meat, fish and eggs products, 397 milk and dairy, 176 fats and sauces, 179 composite dishes, 424 sugary snacks, 91 salty snacks. Overall, the mean FSAm-NSP score was 9+/- 9.4 points.
The overall distribution of the FSAm-NSP score is represented in Figure 1.
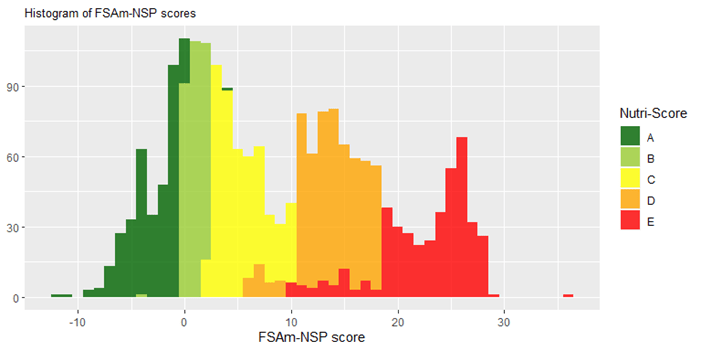
Figure 1: Overall distribution of the FSAm-NSP score
The distribution of the Nutri-Score in the different food groups is represented in Figures 2, 3 and 4.
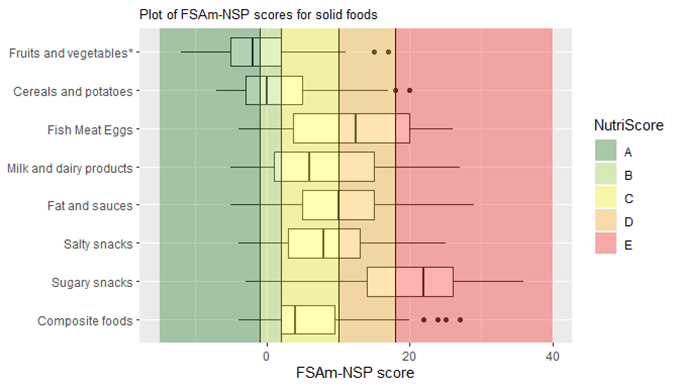
Figure 2: Distribution of the FSAm-NSP score for solid foods.
Vertical lines represent the cut-offs of the 5-category Nutriscore. The boundary of the box nearest to the left indicates the 25th percentile, the line within the box marks the median, and the boundary of the box furthest from the left indicates the 75th percentile. Whiskers (error bars) left and right of the box indicate the lower limit (25th percentile – 1.5 * (Inter-quartile range) and the upper limit (75th percentile + 1.5 * (Inter-quartile range)). The circles are individual outlier points. *Products containing mainly fruits and vegetables
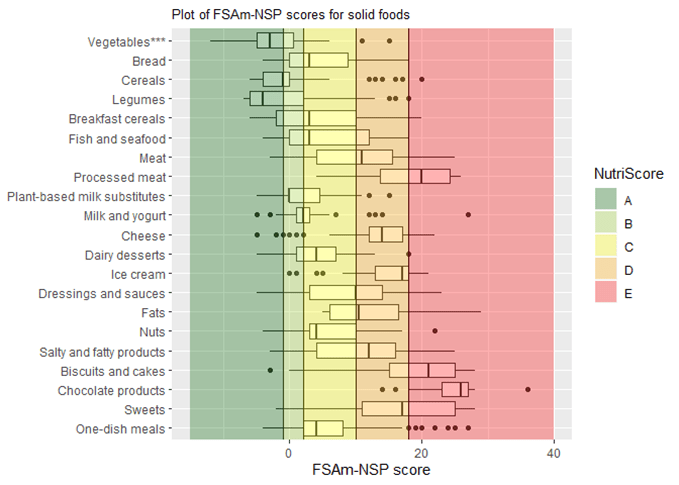
Figure 3: Distribution of the FSAm-NSP score for solid foods in subgroups containing more than 20 items.
Vertical lines represent the cut-offs of the 5-category Nutriscore. The boundary of the box nearest to the left indicates the 25th percentile, the line within the box marks the median, and the boundary of the box furthest from the left indicates the 75th percentile. Whiskers (error bars) left and right of the box indicate the lower limit (25th percentile – 1.5 * (Inter-quartile range) and the upper limit (75th percentile + 1.5 * (Inter-quartile range)). The circles are individual outlier points. ** Fruits based products ; *** Vegetables based products
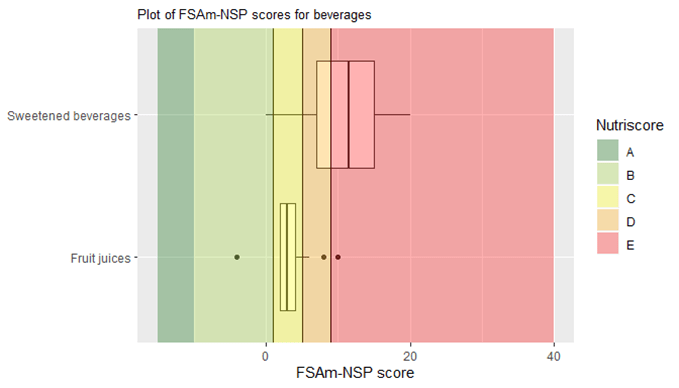
Figure 4: Distribution of the FSAm-NSP score for beverages.
Vertical lines represent the cut-offs of the 5-category Nutriscore. The boundary of the box nearest to the left indicates the 25th percentile, the line within the box marks the median, and the boundary of the box furthest from the left indicates the 75th percentile. Whiskers (error bars) left and right of the box indicate the lower limit (25th percentile – 1.5 * (Inter-quartile range) and the upper limit (75th percentile + 1.5 * (Inter-quartile range)). The circles are individual outlier points. By definition, only water is classified as A and is shown at the top of the plot.
The distribution of the Nutri-Score within the different food groups is displayed in Table 1.
Table 1: Distribution of the Nutri-Score within the different food groups. ** Fruits based products ; *** Vegetables based products.
| A | B | C | D | E | Total | ||
| Fruits and vegetables* | 64(61%) | 19(18.1%) | 18(17.1%) | 4(3.8%) | 0(0%) | 105 | |
| Vegetables*** | 52(65.8%) | 17(21.5%) | 7(8.9%) | 3(3.8%) | 0(0%) | 79 | |
| Dried fruits | 1(11.1%) | 1(11.1%) | 7(77.8%) | 0(0%) | 0(0%) | 9 | |
| Fruits** | 11(73.3%) | 1(6.7%) | 2(13.3%) | 1(6.7%) | 0(0%) | 15 | |
| Soups | 0(0%) | 0(0%) | 2(100%) | 0(0%) | 0(0%) | 2 | |
| Cereals and potatoes | 168(47.6%) | 58(16.4%) | 74(21%) | 51(14.4%) | 2(0.6%) | 353 | |
| Bread | 17(20.7%) | 21(25.6%) | 25(30.5%) | 19(23.2%) | 0(0%) | 82 | |
| Cereals | 83(68%) | 19(15.6%) | 14(11.5%) | 5(4.1%) | 1(0.8%) | 122 | |
| Legumes | 30(66.7%) | 4(8.9%) | 5(11.1%) | 6(13.3%) | 0(0%) | 45 | |
| Potatoes | 5(41.7%) | 3(25%) | 4(33.3%) | 0(0%) | 0(0%) | 12 | |
| Breakfast cereals | 33(35.9%) | 11(12%) | 26(28.3%) | 21(22.8%) | 1(1.1%) | 92 | |
| Fish Meat Eggs | 12(7.9%) | 19(12.5%) | 27(17.8%) | 52(34.2%) | 42(27.6%) | 152 | |
| Fish and seafood | 10(16.4%) | 18(29.5%) | 13(21.3%) | 20(32.8%) | 0(0%) | 61 | |
| Meat | 1(4.5%) | 1(4.5%) | 8(36.4%) | 9(40.9%) | 3(13.6%) | 22 | |
| Processed meat | 0(0%) | 0(0%) | 6(8.8%) | 23(33.8%) | 39(57.4%) | 68 | |
| Eggs | 1(100%) | 0(0%) | 0(0%) | 0(0%) | 0(0%) | 1 | |
| Milk and dairy products | 37(9.3%) | 114(28.7%) | 77(19.4%) | 152(38.3%) | 17(4.3%) | 397 | |
| Plant-based milk substitutes | 8(20.5%) | 20(51.3%) | 3(7.7%) | 7(17.9%) | 1(2.6%) | 39 | |
| Milk and yogurt | 16(11.1%) | 77(53.5%) | 41(28.5%) | 9(6.2%) | 1(0.7%) | 144 | |
| Cheese | 6(4.4%) | 9(6.6%) | 12(8.8%) | 104(75.9%) | 6(4.4%) | 137 | |
| Dairy desserts | 7(21.9%) | 5(15.6%) | 16(50%) | 4(12.5%) | 0(0%) | 32 | |
| Ice cream | 0(0%) | 3(6.7%) | 5(11.1%) | 28(62.2%) | 9(20%) | 45 | |
| Fat and sauces | 16(9.1%) | 16(9.1%) | 61(34.7%) | 64(36.4%) | 19(10.8%) | 176 | |
| Dressings and sauces | 16(11.8%) | 16(11.8%) | 41(30.1%) | 53(39%) | 10(7.4%) | 136 | |
| Fats | 0(0%) | 0(0%) | 20(50%) | 11(27.5%) | 9(22.5%) | 40 | |
| Salty snacks | 8(8.8%) | 9(9.9%) | 40(44%) | 31(34.1%) | 3(3.3%) | 91 | |
| Appetizers | 0(0%) | 0(0%) | 6(46.2%) | 7(53.8%) | 0(0%) | 13 | |
| Nuts | 6(14.6%) | 4(9.8%) | 23(56.1%) | 7(17.1%) | 1(2.4%) | 41 | |
| Salty and fatty products | 2(5.4%) | 5(13.5%) | 11(29.7%) | 17(45.9%) | 2(5.4%) | 37 | |
| Sugary snacks | 7(1.7%) | 14(3.3%) | 33(7.8%) | 101(23.8%) | 269(63.4%) | 424 | |
| Biscuits and cakes | 1(0.6%) | 4(2.4%) | 13(7.9%) | 46(28%) | 100(61%) | 164 | |
| Chocolate products | 0(0%) | 0(0%) | 0(0%) | 3(3.2%) | 90(96.8%) | 93 | |
| Sweets | 6(3.7%) | 10(6.2%) | 19(11.8%) | 48(29.8%) | 78(48.4%) | 161 | |
| Pastries | 0(0%) | 0(0%) | 1(16.7%) | 4(66.7%) | 1(16.7%) | 6 | |
| Composite foods | 14(7.8%) | 33(18.4%) | 91(50.8%) | 35(19.6%) | 6(3.4%) | 179 | |
| One-dish meals | 14(9.1%) | 27(17.5%) | 77(50%) | 30(19.5%) | 6(3.9%) | 154 | |
| Pizza pies and quiches | 0(0%) | 4(22.2%) | 12(66.7%) | 2(11.1%) | 0(0%) | 18 | |
| Sandwiches | 0(0%) | 2(28.6%) | 2(28.6%) | 3(42.9%) | 0(0%) | 7 | |
| Beverages | 20(13%) | 11(7.1%) | 34(22.1%) | 35(22.7%) | 54(35.1%) | 154 | |
| Waters | 19(100%) | 0(0%) | 0(0%) | 0(0%) | 0(0%) | 19 | |
| Teas and herbal teas and coffees | 0(0%) | 1(14.3%) | 1(14.3%) | 2(28.6%) | 3(42.9%) | 7 | |
| Fruit juices | 0(0%) | 1(3.6%) | 24(85.7%) | 2(7.1%) | 1(3.6%) | 28 | |
| Artificially sweetened beverages | 1(5%) | 7(35%) | 5(25%) | 5(25%) | 2(10%) | 20 | |
| Sweetened beverages | 0(0%) | 2(2.5%) | 4(5%) | 26(32.5%) | 48(60%) | 80 | |
| Sum | 346(17%) | 293(14.4%) | 455(22.4%) | 525(25.8%) | 412(20.3%) | 2031 |
Results for Belgium
For Belgium, the OpenFoodFact table included 53829 foods. From this list, 39330 products could not be affected to a specific food group and were deleted from the list. Then, 1240 products were removed because the nutritional informations necessary to the calculation of the NutriScore were missing. 18 products were deleted after additionnal quality controls. Finally, the OpenFoodFact table used for this document included 13241 foods. The database contained 945 products composed mainly of fruits and vegetables, 1795 bread and cereal products, 1464 meat, fish and eggs products, 2122 milk and dairy, 1223 fats and sauces, 999 composite dishes, 2686 sugary snacks, 766 salty snacks. Overall, the mean FSAm-NSP score was 8.9+/- 8.9 points.
The overall distribution of the FSAm-NSP score is represented in Figure 1.
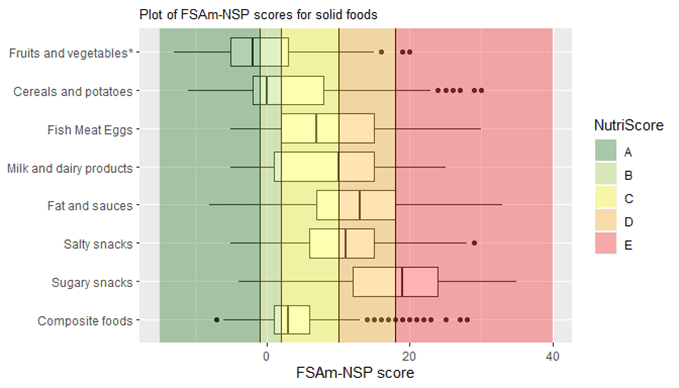
Figure 1: Overall distribution of the FSAm-NSP score
The distribution of the Nutri-Score in the different food groups is represented in Figures 2, 3 and 4.

Figure 2: Distribution of the FSAm-NSP score for solid foods.
Vertical lines represent the cut-offs of the 5-category Nutriscore. The boundary of the box nearest to the left indicates the 25th percentile, the line within the box marks the median, and the boundary of the box furthest from the left indicates the 75th percentile. Whiskers (error bars) left and right of the box indicate the lower limit (25th percentile – 1.5 * (Inter-quartile range) and the upper limit (75th percentile + 1.5 * (Inter-quartile range)). The circles are individual outlier points. *Products containing mainly fruits and vegetables
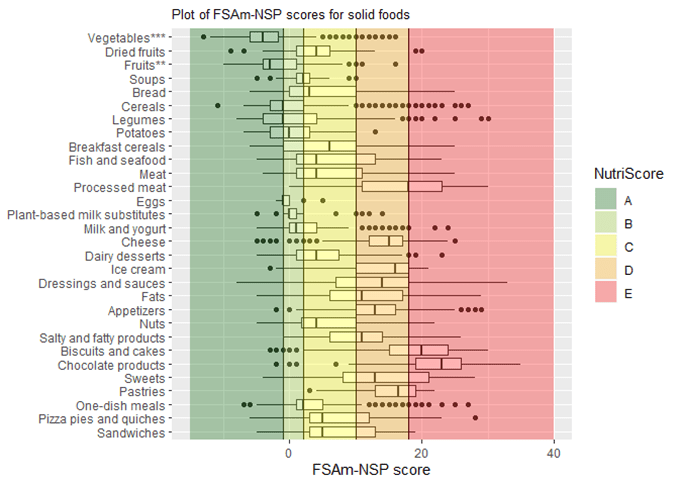
Figure 3: Distribution of the FSAm-NSP score for solid foods in subgroups containing more than 20 items.
Vertical lines represent the cut-offs of the 5-category Nutriscore. The boundary of the box nearest to the left indicates the 25th percentile, the line within the box marks the median, and the boundary of the box furthest from the left indicates the 75th percentile. Whiskers (error bars) left and right of the box indicate the lower limit (25th percentile – 1.5 * (Inter-quartile range) and the upper limit (75th percentile + 1.5 * (Inter-quartile range)). The circles are individual outlier points. ** Fruits based products ; *** Vegetables based products
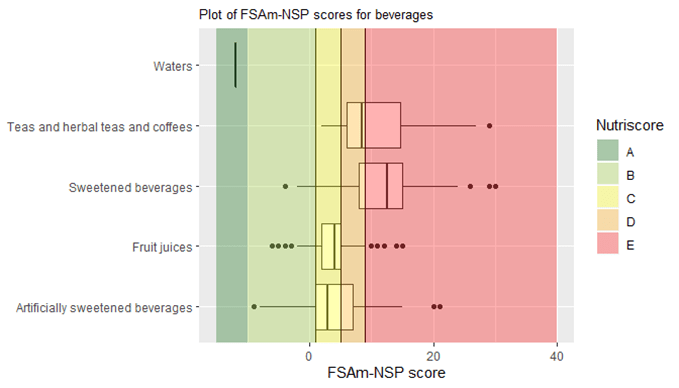
Figure 4: Distribution of the FSAm-NSP score for beverages.
Vertical lines represent the cut-offs of the 5-category Nutriscore. The boundary of the box nearest to the left indicates the 25th percentile, the line within the box marks the median, and the boundary of the box furthest from the left indicates the 75th percentile. Whiskers (error bars) left and right of the box indicate the lower limit (25th percentile – 1.5 * (Inter-quartile range) and the upper limit (75th percentile + 1.5 * (Inter-quartile range)). The circles are individual outlier points. By definition, only water is classified as A and is shown at the top of the plot.
The distribution of the Nutri-Score within the different food groups is displayed in Table 1.
Table 1: Distribution of the Nutri-Score within the different food groups. ** Fruits based products ; *** Vegetables based products.
| A | B | C | D | E | Total | ||
| Fruits and vegetables* | 561(59.4%) | 147(15.6%) | 220(23.3%) | 15(1.6%) | 2(0.2%) | 945 | |
| Vegetables*** | 372(78.8%) | 46(9.7%) | 46(9.7%) | 8(1.7%) | 0(0%) | 472 | |
| Dried fruits | 16(11.9%) | 33(24.6%) | 79(59%) | 4(3%) | 2(1.5%) | 134 | |
| Fruits** | 162(66.9%) | 29(12%) | 48(19.8%) | 3(1.2%) | 0(0%) | 242 | |
| Soups | 11(11.3%) | 39(40.2%) | 47(48.5%) | 0(0%) | 0(0%) | 97 | |
| Cereals and potatoes | 723(40.3%) | 328(18.3%) | 428(23.8%) | 264(14.7%) | 52(2.9%) | 1795 | |
| Bread | 80(20.8%) | 89(23.2%) | 128(33.3%) | 75(19.5%) | 12(3.1%) | 384 | |
| Cereals | 384(58%) | 127(19.2%) | 67(10.1%) | 64(9.7%) | 20(3%) | 662 | |
| Legumes | 99(55.9%) | 20(11.3%) | 26(14.7%) | 22(12.4%) | 10(5.6%) | 177 | |
| Potatoes | 32(41.6%) | 22(28.6%) | 22(28.6%) | 1(1.3%) | 0(0%) | 77 | |
| Breakfast cereals | 128(25.9%) | 70(14.1%) | 185(37.4%) | 102(20.6%) | 10(2%) | 495 | |
| Fish Meat Eggs | 167(11.4%) | 215(14.7%) | 362(24.7%) | 493(33.7%) | 227(15.5%) | 1464 | |
| Fish and seafood | 66(13.4%) | 127(25.8%) | 96(19.5%) | 199(40.4%) | 5(1%) | 493 | |
| Meat | 89(19.6%) | 65(14.3%) | 174(38.2%) | 110(24.2%) | 17(3.7%) | 455 | |
| Processed meat | 0(0%) | 14(2.9%) | 90(18.6%) | 176(36.4%) | 204(42.1%) | 484 | |
| Eggs | 12(54.5%) | 9(40.9%) | 1(4.5%) | 0(0%) | 0(0%) | 22 | |
| Offals | 0(0%) | 0(0%) | 1(10%) | 8(80%) | 1(10%) | 10 | |
| Milk and dairy products | 218(10.3%) | 492(23.2%) | 392(18.5%) | 915(43.1%) | 105(4.9%) | 2122 | |
| Plant-based milk substitutes | 27(18.2%) | 92(62.2%) | 11(7.4%) | 18(12.2%) | 0(0%) | 148 | |
| Milk and yogurt | 147(20.8%) | 331(46.8%) | 167(23.6%) | 61(8.6%) | 2(0.3%) | 708 | |
| Cheese | 12(1.4%) | 21(2.4%) | 99(11.2%) | 691(78.1%) | 62(7%) | 885 | |
| Dairy desserts | 27(15.1%) | 39(21.8%) | 77(43%) | 33(18.4%) | 3(1.7%) | 179 | |
| Ice cream | 5(2.5%) | 9(4.5%) | 38(18.8%) | 112(55.4%) | 38(18.8%) | 202 | |
| Fat and sauces | 45(3.7%) | 46(3.8%) | 340(27.8%) | 523(42.8%) | 269(22%) | 1223 | |
| Dressings and sauces | 43(4.8%) | 45(5%) | 198(22%) | 416(46.3%) | 196(21.8%) | 898 | |
| Fats | 2(0.6%) | 1(0.3%) | 142(43.7%) | 107(32.9%) | 73(22.5%) | 325 | |
| Salty snacks | 29(3.8%) | 51(6.7%) | 261(34.1%) | 349(45.6%) | 76(9.9%) | 766 | |
| Appetizers | 1(0.3%) | 12(3.6%) | 87(26%) | 193(57.8%) | 41(12.3%) | 334 | |
| Nuts | 24(15.8%) | 24(15.8%) | 70(46.1%) | 31(20.4%) | 3(2%) | 152 | |
| Salty and fatty products | 4(1.4%) | 15(5.4%) | 104(37.1%) | 125(44.6%) | 32(11.4%) | 280 | |
| Sugary snacks | 46(1.7%) | 108(4%) | 309(11.5%) | 845(31.5%) | 1378(51.3%) | 2686 | |
| Biscuits and cakes | 8(0.7%) | 27(2.4%) | 92(8.3%) | 306(27.5%) | 681(61.1%) | 1114 | |
| Chocolate products | 1(0.2%) | 4(0.8%) | 7(1.4%) | 99(19.2%) | 404(78.4%) | 515 | |
| Sweets | 37(3.7%) | 77(7.7%) | 203(20.4%) | 405(40.7%) | 273(27.4%) | 995 | |
| Pastries | 0(0%) | 0(0%) | 7(11.3%) | 35(56.5%) | 20(32.3%) | 62 | |
| Composite foods | 130(13%) | 318(31.8%) | 366(36.6%) | 169(16.9%) | 16(1.6%) | 999 | |
| One-dish meals | 124(15.5%) | 280(35%) | 295(36.9%) | 90(11.3%) | 10(1.3%) | 799 | |
| Pizza pies and quiches | 4(3%) | 26(19.5%) | 46(34.6%) | 52(39.1%) | 5(3.8%) | 133 | |
| Sandwiches | 2(3%) | 12(17.9%) | 25(37.3%) | 27(40.3%) | 1(1.5%) | 67 | |
| Beverages | 210(16.9%) | 137(11%) | 290(23.4%) | 262(21.1%) | 342(27.6%) | 1241 | |
| Waters | 209(100%) | 0(0%) | 0(0%) | 0(0%) | 0(0%) | 209 | |
| Teas and herbal teas and coffees | 0(0%) | 0(0%) | 2(3%) | 36(54.5%) | 28(42.4%) | 66 | |
| Fruit juices | 0(0%) | 28(10%) | 216(77.4%) | 26(9.3%) | 9(3.2%) | 279 | |
| Fruit nectars | 0(0%) | 0(0%) | 0(0%) | 3(23.1%) | 10(76.9%) | 13 | |
| Artificially sweetened beverages | 0(0%) | 92(36.5%) | 47(18.7%) | 99(39.3%) | 14(5.6%) | 252 | |
| Sweetened beverages | 1(0.2%) | 17(4%) | 25(5.9%) | 98(23.2%) | 281(66.6%) | 422 | |
| Sum | 2129(16.1%) | 1842(13.9%) | 2968(22.4%) | 3835(29%) | 2467(18.6%) | 13241 |
Results for Finland
For Finland, the OpenFoodFact table included 1915 foods. From this list, 639 products could not be affected to a specific food group and were deleted from the list. Then, 136 products were removed because the nutritional informations necessary to the calculation of the NutriScore were missing. 0 products were deleted after additionnal quality controls. Finally, the OpenFoodFact table used for this document included 1140 foods. The database contained 40 products composed mainly of fruits and vegetables, 200 bread and cereal products, 112 meat, fish and eggs products, 201 milk and dairy, 69 fats and sauces, 109 composite dishes, 315 sugary snacks, 22 salty snacks. Overall, the mean FSAm-NSP score was 9+/- 10 points.
The overall distribution of the FSAm-NSP score is represented in Figure 1.
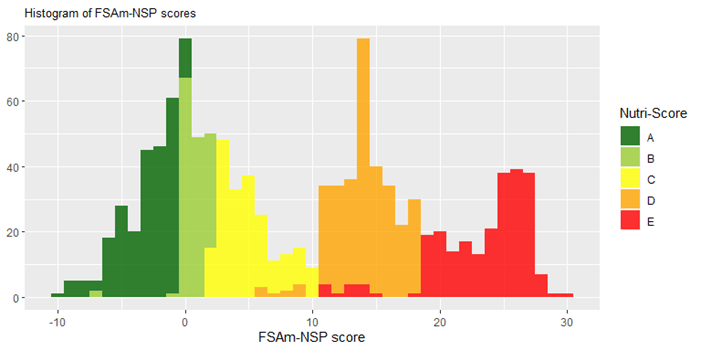
Figure 1: Overall distribution of the FSAm-NSP score
The distribution of the Nutri-Score in the different food groups is represented in Figures 2, 3 and 4.
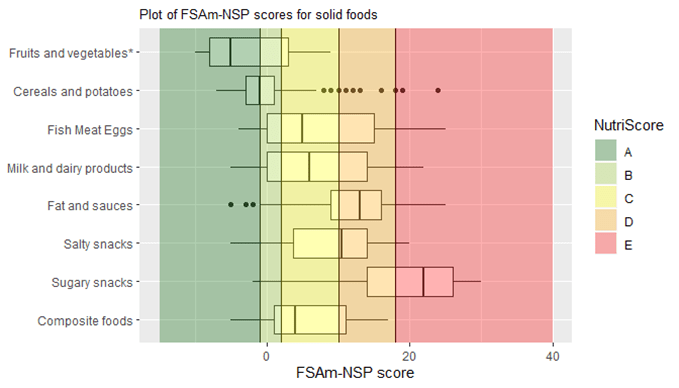
Figure 2: Distribution of the FSAm-NSP score for solid foods.
Vertical lines represent the cut-offs of the 5-category Nutriscore. The boundary of the box nearest to the left indicates the 25th percentile, the line within the box marks the median, and the boundary of the box furthest from the left indicates the 75th percentile. Whiskers (error bars) left and right of the box indicate the lower limit (25th percentile – 1.5 * (Inter-quartile range) and the upper limit (75th percentile + 1.5 * (Inter-quartile range)). The circles are individual outlier points. *Products containing mainly fruits and vegetables
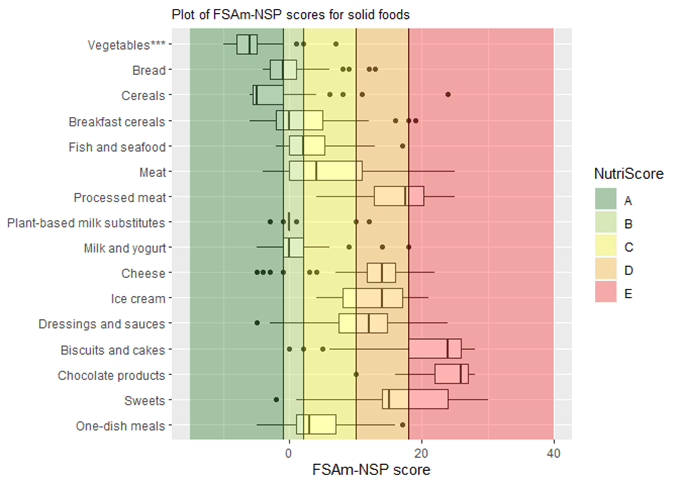
Figure 3: Distribution of the FSAm-NSP score for solid foods in subgroups containing more than 20 items.
Vertical lines represent the cut-offs of the 5-category Nutriscore. The boundary of the box nearest to the left indicates the 25th percentile, the line within the box marks the median, and the boundary of the box furthest from the left indicates the 75th percentile. Whiskers (error bars) left and right of the box indicate the lower limit (25th percentile – 1.5 * (Inter-quartile range) and the upper limit (75th percentile + 1.5 * (Inter-quartile range)). The circles are individual outlier points. ** Fruits based products ; *** Vegetables based product
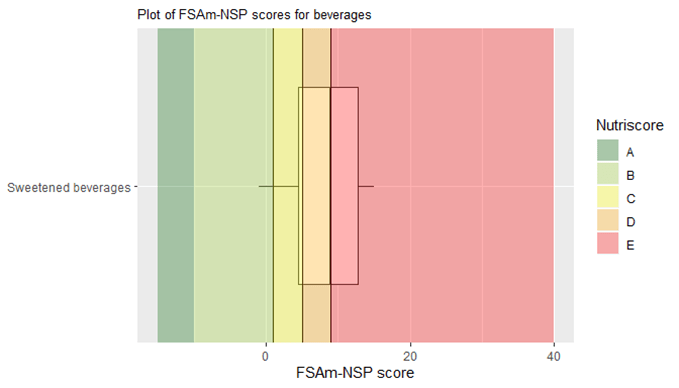
Figure 4: Distribution of the FSAm-NSP score for beverages.
Vertical lines represent the cut-offs of the 5-category Nutriscore.
The boundary of the box nearest to the left indicates the 25th percentile, the line within the box marks the median, and the boundary of the box furthest from the left indicates the 75th percentile. Whiskers (error bars) left and right of the box indicate the lower limit (25th percentile – 1.5 * (Inter-quartile range) and the upper limit (75th percentile + 1.5 * (Inter-quartile range)). The circles are individual outlier points. By definition, only water is classified as A and is shown at the top of the plot.
The distribution of the Nutri-Score within the different food groups is displayed in Table 1.
Table 1: Distribution of the Nutri-Score within the different food groups. ** Fruits based products ; *** Vegetables based products.
| A | B | C | D | E | Total | ||
| Fruits and vegetables* | 26(65%) | 3(7.5%) | 11(27.5%) | 0(0%) | 0(0%) | 40 | |
| Vegetables*** | 17(81%) | 3(14.3%) | 1(4.8%) | 0(0%) | 0(0%) | 21 | |
| Dried fruits | 1(25%) | 0(0%) | 3(75%) | 0(0%) | 0(0%) | 4 | |
| Fruits** | 8(66.7%) | 0(0%) | 4(33.3%) | 0(0%) | 0(0%) | 12 | |
| Soups | 0(0%) | 0(0%) | 3(100%) | 0(0%) | 0(0%) | 3 | |
| Cereals and potatoes | 120(60%) | 39(19.5%) | 30(15%) | 9(4.5%) | 2(1%) | 200 | |
| Bread | 74(64.3%) | 25(21.7%) | 11(9.6%) | 5(4.3%) | 0(0%) | 115 | |
| Cereals | 27(77.1%) | 3(8.6%) | 3(8.6%) | 1(2.9%) | 1(2.9%) | 35 | |
| Legumes | 2(50%) | 2(50%) | 0(0%) | 0(0%) | 0(0%) | 4 | |
| Potatoes | 0(0%) | 3(50%) | 3(50%) | 0(0%) | 0(0%) | 6 | |
| Breakfast cereals | 17(42.5%) | 6(15%) | 13(32.5%) | 3(7.5%) | 1(2.5%) | 40 | |
| Fish Meat Eggs | 16(14.3%) | 22(19.6%) | 27(24.1%) | 31(27.7%) | 16(14.3%) | 112 | |
| Fish and seafood | 3(12.5%) | 11(45.8%) | 5(20.8%) | 5(20.8%) | 0(0%) | 24 | |
| Meat | 12(21.8%) | 11(20%) | 16(29.1%) | 11(20%) | 5(9.1%) | 55 | |
| Processed meat | 0(0%) | 0(0%) | 6(18.8%) | 15(46.9%) | 11(34.4%) | 32 | |
| Eggs | 1(100%) | 0(0%) | 0(0%) | 0(0%) | 0(0%) | 1 | |
| Milk and dairy products | 43(21.4%) | 46(22.9%) | 27(13.4%) | 78(38.8%) | 7(3.5%) | 201 | |
| Plant-based milk substitutes | 3(13%) | 18(78.3%) | 1(4.3%) | 1(4.3%) | 0(0%) | 23 | |
| Milk and yogurt | 20(33.9%) | 28(47.5%) | 9(15.3%) | 2(3.4%) | 0(0%) | 59 | |
| Cheese | 9(14.1%) | 0(0%) | 3(4.7%) | 49(76.6%) | 3(4.7%) | 64 | |
| Dairy desserts | 11(91.7%) | 0(0%) | 1(8.3%) | 0(0%) | 0(0%) | 12 | |
| Ice cream | 0(0%) | 0(0%) | 13(30.2%) | 26(60.5%) | 4(9.3%) | 43 | |
| Fat and sauces | 7(10.1%) | 1(1.4%) | 13(18.8%) | 34(49.3%) | 14(20.3%) | 69 | |
| Dressings and sauces | 7(14%) | 1(2%) | 8(16%) | 30(60%) | 4(8%) | 50 | |
| Fats | 0(0%) | 0(0%) | 5(26.3%) | 4(21.1%) | 10(52.6%) | 19 | |
| Salty snacks | 4(18.2%) | 0(0%) | 7(31.8%) | 9(40.9%) | 2(9.1%) | 22 | |
| Appetizers | 0(0%) | 0(0%) | 4(44.4%) | 5(55.6%) | 0(0%) | 9 | |
| Nuts | 4(57.1%) | 0(0%) | 1(14.3%) | 2(28.6%) | 0(0%) | 7 | |
| Salty and fatty products | 0(0%) | 0(0%) | 2(33.3%) | 2(33.3%) | 2(33.3%) | 6 | |
| Sugary snacks | 1(0.3%) | 9(2.9%) | 15(4.8%) | 103(32.7%) | 187(59.4%) | 315 | |
| Biscuits and cakes | 0(0%) | 2(2.1%) | 4(4.2%) | 22(23.2%) | 67(70.5%) | 95 | |
| Chocolate products | 0(0%) | 0(0%) | 1(1.6%) | 2(3.2%) | 59(95.2%) | 62 | |
| Sweets | 1(0.6%) | 7(4.5%) | 10(6.4%) | 78(49.7%) | 61(38.9%) | 157 | |
| Pastries | 0(0%) | 0(0%) | 0(0%) | 1(100%) | 0(0%) | 1 | |
| Composite foods | 14(12.8%) | 25(22.9%) | 41(37.6%) | 29(26.6%) | 0(0%) | 109 | |
| One-dish meals | 13(14.9%) | 22(25.3%) | 32(36.8%) | 20(23%) | 0(0%) | 87 | |
| Pizza pies and quiches | 1(5.3%) | 3(15.8%) | 7(36.8%) | 8(42.1%) | 0(0%) | 19 | |
| Sandwiches | 0(0%) | 0(0%) | 2(66.7%) | 1(33.3%) | 0(0%) | 3 | |
| Beverages | 12(16.7%) | 9(12.5%) | 25(34.7%) | 11(15.3%) | 15(20.8%) | 72 | |
| Waters | 12(100%) | 0(0%) | 0(0%) | 0(0%) | 0(0%) | 12 | |
| Fruit juices | 0(0%) | 3(27.3%) | 8(72.7%) | 0(0%) | 0(0%) | 11 | |
| Artificially sweetened beverages | 0(0%) | 5(33.3%) | 9(60%) | 0(0%) | 1(6.7%) | 15 | |
| Sweetened beverages | 0(0%) | 1(2.9%) | 8(23.5%) | 11(32.4%) | 14(41.2%) | 34 | |
| Sum | 243(21.3%) | 154(13.5%) | 196(17.2%) | 304(26.7%) | 243(21.3%) | 1140 |
Page break
Results for France
For France, the OpenFoodFact table included 338885 foods. From this list, 63121 products could not be affected to a specific food group and were deleted from the list. Then, 35905 products were removed because the nutritional informations necessary to the calculation of the NutriScore were missing. 123 products were deleted after additionnal quality controls. Finally, the OpenFoodFact table used for this document included 239736 foods. The database contained 17253 products composed mainly of fruits and vegetables, 24346 bread and cereal products, 35721 meat, fish and eggs products, 33416 milk and dairy, 18460 fats and sauces, 24106 composite dishes, 52951 sugary snacks, 17246 salty snacks. Overall, the mean FSAm-NSP score was 9.5+/- 8.9 points.
The overall distribution of the FSAm-NSP score is represented in Figure 1.
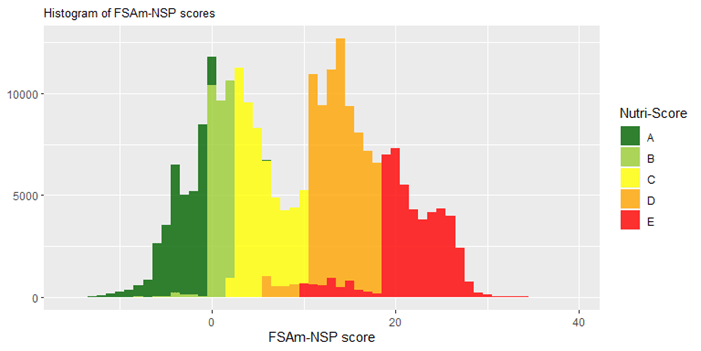
Figure 1: Overall distribution of the FSAm-NSP score
The distribution of the Nutri-Score in the different food groups is represented in Figures 2, 3 and 4.
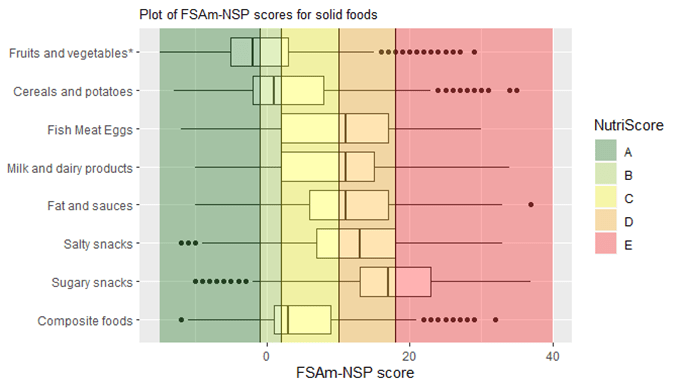
Figure 2: Distribution of the FSAm-NSP score for solid foods.
Vertical lines represent the cut-offs of the 5-category Nutriscore. The boundary of the box nearest to the left indicates the 25th percentile, the line within the box marks the median, and the boundary of the box furthest from the left indicates the 75th percentile. Whiskers (error bars) left and right of the box indicate the lower limit (25th percentile – 1.5 * (Inter-quartile range) and the upper limit (75th percentile + 1.5 * (Inter-quartile range)). The circles are individual outlier points. *Products containing mainly fruits and vegetables
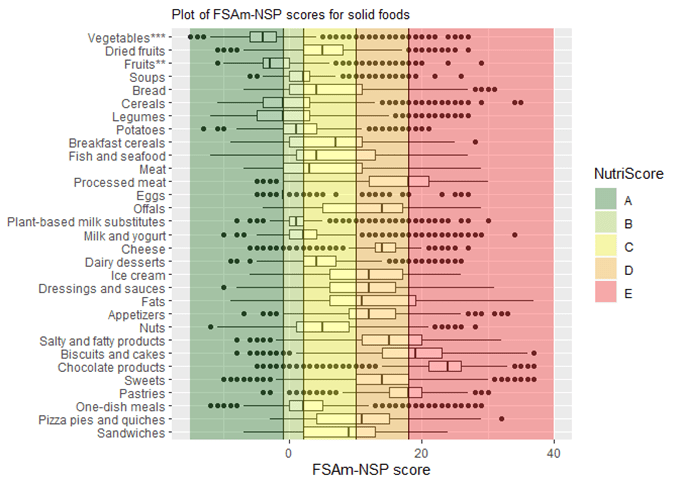
Figure 3: Distribution of the FSAm-NSP score for solid foods in subgroups containing more than 20 items.
Vertical lines represent the cut-offs of the 5-category Nutriscore. The boundary of the box nearest to the left indicates the 25th percentile, the line within the box marks the median, and the boundary of the box furthest from the left indicates the 75th percentile. Whiskers (error bars) left and right of the box indicate the lower limit (25th percentile – 1.5 * (Inter-quartile range) and the upper limit (75th percentile + 1.5 * (Inter-quartile range)). The circles are individual outlier points. ** Fruits based products ; *** Vegetables based products
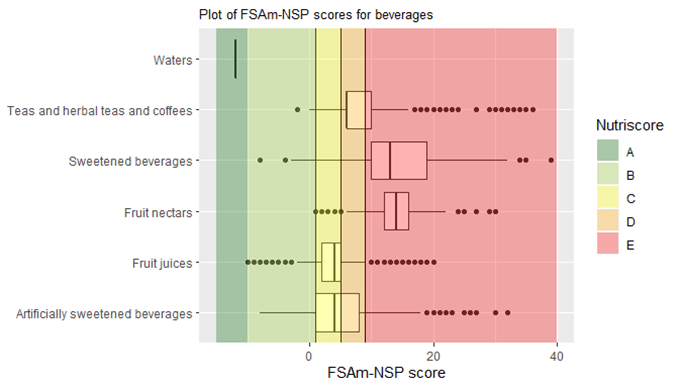
Figure 4: Distribution of the FSAm-NSP score for beverages.
Vertical lines represent the cut-offs of the 5-category Nutriscore. The boundary of the box nearest to the left indicates the 25th percentile, the line within the box marks the median, and the boundary of the box furthest from the left indicates the 75th percentile. Whiskers (error bars) left and right of the box indicate the lower limit (25th percentile – 1.5 * (Inter-quartile range) and the upper limit (75th percentile + 1.5 * (Inter-quartile range)). The circles are individual outlier points. By definition, only water is classified as A and is shown at the top of the plot.
The distribution of the Nutri-Score within the different food groups is displayed in Table 1.
Table 1: Distribution of the Nutri-Score within the different food groups. ** Fruits based products ; *** Vegetables based products.
| A | B | C | D | E | Total | ||
| Fruits and vegetables* | 10295(59.7%) | 2521(14.6%) | 3753(21.8%) | 618(3.6%) | 66(0.4%) | 17253 | |
| Vegetables*** | 6134(79.5%) | 711(9.2%) | 722(9.4%) | 132(1.7%) | 13(0.2%) | 7712 | |
| Dried fruits | 410(13.1%) | 586(18.7%) | 1775(56.5%) | 331(10.5%) | 38(1.2%) | 3140 | |
| Fruits** | 3502(73.5%) | 361(7.6%) | 769(16.1%) | 121(2.5%) | 12(0.3%) | 4765 | |
| Soups | 249(15.2%) | 863(52.8%) | 487(29.8%) | 34(2.1%) | 3(0.2%) | 1636 | |
| Cereals and potatoes | 9917(40.7%) | 4495(18.5%) | 4932(20.3%) | 4163(17.1%) | 839(3.4%) | 24346 | |
| Bread | 1084(18.8%) | 1320(22.8%) | 1758(30.4%) | 1487(25.7%) | 129(2.2%) | 5778 | |
| Cereals | 6114(55.9%) | 1884(17.2%) | 1146(10.5%) | 1274(11.7%) | 517(4.7%) | 10935 | |
| Legumes | 1316(56.9%) | 404(17.5%) | 192(8.3%) | 277(12%) | 124(5.4%) | 2313 | |
| Potatoes | 473(33.7%) | 401(28.6%) | 463(33%) | 59(4.2%) | 6(0.4%) | 1402 | |
| Breakfast cereals | 930(23.7%) | 486(12.4%) | 1373(35%) | 1066(27.2%) | 63(1.6%) | 3918 | |
| Fish Meat Eggs | 4688(13.1%) | 4810(13.5%) | 7243(20.3%) | 11641(32.6%) | 7339(20.5%) | 35721 | |
| Fish and seafood | 1249(14.1%) | 1951(22.1%) | 2251(25.4%) | 3292(37.2%) | 105(1.2%) | 8848 | |
| Meat | 2776(26.9%) | 2318(22.5%) | 2607(25.3%) | 2162(21%) | 454(4.4%) | 10317 | |
| Processed meat | 35(0.2%) | 357(2.4%) | 2223(15%) | 5594(37.7%) | 6632(44.7%) | 14841 | |
| Eggs | 601(79.5%) | 90(11.9%) | 30(4%) | 27(3.6%) | 8(1.1%) | 756 | |
| Offals | 27(2.8%) | 94(9.8%) | 132(13.8%) | 566(59%) | 140(14.6%) | 959 | |
| Milk and dairy products | 2427(7.3%) | 5976(17.9%) | 7866(23.5%) | 15550(46.5%) | 1597(4.8%) | 33416 | |
| Plant-based milk substitutes | 313(21.1%) | 814(54.9%) | 138(9.3%) | 190(12.8%) | 27(1.8%) | 1482 | |
| Milk and yogurt | 1403(14.8%) | 4237(44.8%) | 2830(29.9%) | 906(9.6%) | 88(0.9%) | 9464 | |
| Cheese | 72(0.5%) | 149(1%) | 1550(10.2%) | 12423(81.4%) | 1065(7%) | 15259 | |
| Dairy desserts | 619(15.2%) | 682(16.8%) | 2095(51.6%) | 608(15%) | 59(1.5%) | 4063 | |
| Ice cream | 20(0.6%) | 94(3%) | 1253(39.8%) | 1423(45.2%) | 358(11.4%) | 3148 | |
| Fat and sauces | 836(4.5%) | 1106(6%) | 5916(32%) | 7105(38.5%) | 3497(18.9%) | 18460 | |
| Dressings and sauces | 750(6%) | 1041(8.4%) | 3192(25.6%) | 5554(44.6%) | 1916(15.4%) | 12453 | |
| Fats | 86(1.4%) | 65(1.1%) | 2724(45.3%) | 1551(25.8%) | 1581(26.3%) | 6007 | |
| Salty snacks | 645(3.7%) | 1246(7.2%) | 4781(27.7%) | 6809(39.5%) | 3765(21.8%) | 17246 | |
| Appetizers | 77(1.4%) | 261(4.6%) | 1733(30.4%) | 2848(50%) | 776(13.6%) | 5695 | |
| Nuts | 476(15.5%) | 572(18.6%) | 1459(47.4%) | 491(16%) | 77(2.5%) | 3075 | |
| Salty and fatty products | 92(1.1%) | 413(4.9%) | 1589(18.7%) | 3470(40.9%) | 2912(34.4%) | 8476 | |
| Sugary snacks | 415(0.8%) | 1440(2.7%) | 6138(11.6%) | 20726(39.1%) | 24232(45.8%) | 52951 | |
| Biscuits and cakes | 158(0.7%) | 287(1.3%) | 1923(8.4%) | 8824(38.4%) | 11764(51.2%) | 22956 | |
| Chocolate products | 9(0.1%) | 27(0.4%) | 96(1.3%) | 1030(13.6%) | 6389(84.6%) | 7551 | |
| Sweets | 246(1.3%) | 1098(5.7%) | 3939(20.6%) | 9185(48%) | 4650(24.3%) | 19118 | |
| Pastries | 2(0.1%) | 28(0.8%) | 180(5.4%) | 1687(50.7%) | 1429(43%) | 3326 | |
| Composite foods | 3879(16.1%) | 7309(30.3%) | 7477(31%) | 4611(19.1%) | 830(3.4%) | 24106 | |
| One-dish meals | 3732(18.7%) | 6702(33.6%) | 6226(31.2%) | 2818(14.1%) | 478(2.4%) | 19956 | |
| Pizza pies and quiches | 24(1%) | 269(11.2%) | 780(32.3%) | 1042(43.2%) | 297(12.3%) | 2412 | |
| Sandwiches | 123(7.1%) | 338(19.4%) | 471(27.1%) | 751(43.2%) | 55(3.2%) | 1738 | |
| Beverages | 1405(8.7%) | 1429(8.8%) | 3923(24.2%) | 2717(16.7%) | 6763(41.7%) | 16237 | |
| Waters | 1398(100%) | 0(0%) | 0(0%) | 0(0%) | 0(0%) | 1398 | |
| Teas and herbal teas and coffees | 0(0%) | 34(6.5%) | 85(16.1%) | 270(51.2%) | 138(26.2%) | 527 | |
| Fruit juices | 2(0%) | 681(14.5%) | 3049(65%) | 673(14.3%) | 289(6.2%) | 4694 | |
| Fruit nectars | 0(0%) | 8(1.1%) | 36(5.2%) | 94(13.5%) | 559(80.2%) | 697 | |
| Artificially sweetened beverages | 1(0.1%) | 572(29.8%) | 449(23.4%) | 596(31.1%) | 301(15.7%) | 1919 | |
| Sweetened beverages | 4(0.1%) | 134(1.9%) | 304(4.3%) | 1084(15.5%) | 5476(78.2%) | 7002 | |
| Sum | 34507(14.4%) | 30332(12.7%) | 52029(21.7%) | 73940(30.8%) | 48928(20.4%) | 239736 |
Page break
Results for Germany
For Germany, the OpenFoodFact table included 65188 foods. From this list, 31898 products could not be affected to a specific food group and were deleted from the list. Then, 6150 products were removed because the nutritional informations necessary to the calculation of the NutriScore were missing. 49 products were deleted after additionnal quality controls. Finally, the OpenFoodFact table used for this document included 27091 foods. The database contained 1747 products composed mainly of fruits and vegetables, 4345 bread and cereal products, 2543 meat, fish and eggs products, 5411 milk and dairy, 2296 fats and sauces, 2287 composite dishes, 5029 sugary snacks, 1043 salty snacks. Overall, the mean FSAm-NSP score was 8.8+/- 9.1 points.
The overall distribution of the FSAm-NSP score is represented in Figure 1.

Figure 1: Overall distribution of the FSAm-NSP score
The distribution of the Nutri-Score in the different food groups is represented in Figures 2, 3 and 4.
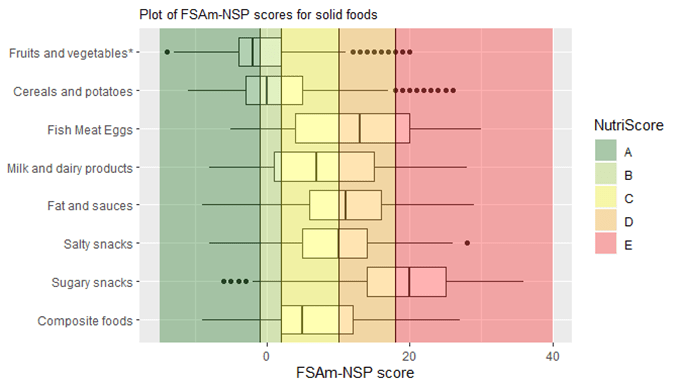
Figure 2: Distribution of the FSAm-NSP score for solid foods.
Vertical lines represent the cut-offs of the 5-category Nutriscore. The boundary of the box nearest to the left indicates the 25th percentile, the line within the box marks the median, and the boundary of the box furthest from the left indicates the 75th percentile. Whiskers (error bars) left and right of the box indicate the lower limit (25th percentile – 1.5 * (Inter-quartile range) and the upper limit (75th percentile + 1.5 * (Inter-quartile range)). The circles are individual outlier points. *Products containing mainly fruits and vegetables

Figure 3: Distribution of the FSAm-NSP score for solid foods in subgroups containing more than 20 items.
Vertical lines represent the cut-offs of the 5-category Nutriscore. The boundary of the box nearest to the left indicates the 25th percentile, the line within the box marks the median, and the boundary of the box furthest from the left indicates the 75th percentile. Whiskers (error bars) left and right of the box indicate the lower limit (25th percentile – 1.5 * (Inter-quartile range) and the upper limit (75th percentile + 1.5 * (Inter-quartile range)). The circles are individual outlier points. ** Fruits based products ; *** Vegetables based products
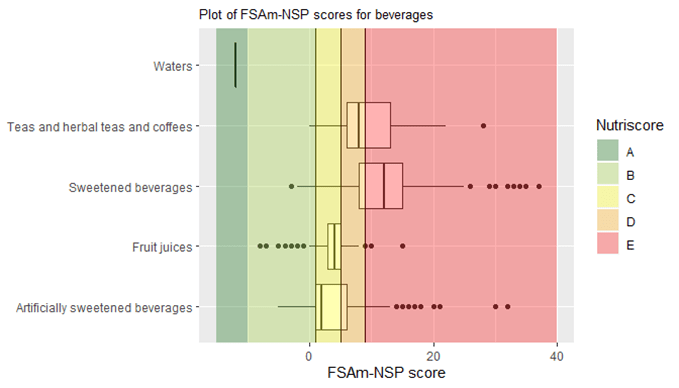
Figure 4: Distribution of the FSAm-NSP score for beverages.
Vertical lines represent the cut-offs of the 5-category Nutriscore. The boundary of the box nearest to the left indicates the 25th percentile, the line within the box marks the median, and the boundary of the box furthest from the left indicates the 75th percentile. Whiskers (error bars) left and right of the box indicate the lower limit (25th percentile – 1.5 * (Inter-quartile range) and the upper limit (75th percentile + 1.5 * (Inter-quartile range)). The circles are individual outlier points. By definition, only water is classified as A and is shown at the top of the plot.
The distribution of the Nutri-Score within the different food groups is displayed in Table 1.
Table 1: Distribution of the Nutri-Score within the different food groups. ** Fruits based products ; *** Vegetables based products.
| A | B | C | D | E | Total | ||
| Fruits and vegetables* | 1029(58.9%) | 321(18.4%) | 353(20.2%) | 41(2.3%) | 3(0.2%) | 1747 | |
| Vegetables*** | 666(63.1%) | 241(22.8%) | 128(12.1%) | 17(1.6%) | 3(0.3%) | 1055 | |
| Dried fruits | 21(8.6%) | 47(19.3%) | 158(65%) | 17(7%) | 0(0%) | 243 | |
| Fruits** | 338(82.4%) | 19(4.6%) | 47(11.5%) | 6(1.5%) | 0(0%) | 410 | |
| Soups | 4(10.3%) | 14(35.9%) | 20(51.3%) | 1(2.6%) | 0(0%) | 39 | |
| Cereals and potatoes | 2074(47.7%) | 757(17.4%) | 919(21.2%) | 516(11.9%) | 79(1.8%) | 4345 | |
| Bread | 265(25.6%) | 225(21.7%) | 364(35.1%) | 165(15.9%) | 18(1.7%) | 1037 | |
| Cereals | 1161(65.2%) | 280(15.7%) | 192(10.8%) | 114(6.4%) | 33(1.9%) | 1780 | |
| Legumes | 276(59.4%) | 70(15.1%) | 41(8.8%) | 59(12.7%) | 19(4.1%) | 465 | |
| Potatoes | 28(19.4%) | 56(38.9%) | 53(36.8%) | 6(4.2%) | 1(0.7%) | 144 | |
| Breakfast cereals | 344(37.4%) | 126(13.7%) | 269(29.3%) | 172(18.7%) | 8(0.9%) | 919 | |
| Fish Meat Eggs | 170(6.7%) | 307(12.1%) | 369(14.5%) | 912(35.9%) | 785(30.9%) | 2543 | |
| Fish and seafood | 114(14.7%) | 184(23.7%) | 174(22.4%) | 291(37.4%) | 15(1.9%) | 778 | |
| Meat | 45(12.6%) | 54(15.2%) | 100(28.1%) | 121(34%) | 36(10.1%) | 356 | |
| Processed meat | 5(0.4%) | 3(0.2%) | 92(6.9%) | 499(37.5%) | 732(55%) | 1331 | |
| Eggs | 6(8.1%) | 66(89.2%) | 1(1.4%) | 1(1.4%) | 0(0%) | 74 | |
| Offals | 0(0%) | 0(0%) | 2(50%) | 0(0%) | 2(50%) | 4 | |
| Milk and dairy products | 682(12.6%) | 1163(21.5%) | 1199(22.2%) | 2181(40.3%) | 186(3.4%) | 5411 | |
| Plant-based milk substitutes | 75(19.8%) | 208(55%) | 37(9.8%) | 54(14.3%) | 4(1.1%) | 378 | |
| Milk and yogurt | 322(17%) | 763(40.4%) | 594(31.4%) | 197(10.4%) | 13(0.7%) | 1889 | |
| Cheese | 212(9%) | 121(5.1%) | 281(11.9%) | 1660(70.2%) | 90(3.8%) | 2364 | |
| Dairy desserts | 67(17.9%) | 60(16%) | 196(52.3%) | 35(9.3%) | 17(4.5%) | 375 | |
| Ice cream | 6(1.5%) | 11(2.7%) | 91(22.5%) | 235(58%) | 62(15.3%) | 405 | |
| Fat and sauces | 87(3.8%) | 142(6.2%) | 786(34.2%) | 945(41.2%) | 336(14.6%) | 2296 | |
| Dressings and sauces | 85(4.8%) | 141(8%) | 565(32.1%) | 801(45.5%) | 169(9.6%) | 1761 | |
| Fats | 2(0.4%) | 1(0.2%) | 221(41.3%) | 144(26.9%) | 167(31.2%) | 535 | |
| Salty snacks | 89(8.5%) | 87(8.3%) | 354(33.9%) | 436(41.8%) | 77(7.4%) | 1043 | |
| Appetizers | 0(0%) | 7(5.3%) | 22(16.8%) | 85(64.9%) | 17(13%) | 131 | |
| Nuts | 79(16%) | 64(12.9%) | 207(41.8%) | 112(22.6%) | 33(6.7%) | 495 | |
| Salty and fatty products | 10(2.4%) | 16(3.8%) | 125(30%) | 239(57.3%) | 27(6.5%) | 417 | |
| Sugary snacks | 81(1.6%) | 156(3.1%) | 405(8.1%) | 1577(31.4%) | 2810(55.9%) | 5029 | |
| Biscuits and cakes | 20(1.1%) | 18(1%) | 135(7.3%) | 606(32.8%) | 1067(57.8%) | 1846 | |
| Chocolate products | 1(0.1%) | 4(0.4%) | 4(0.4%) | 96(8.5%) | 1023(90.7%) | 1128 | |
| Sweets | 60(3%) | 133(6.6%) | 263(13.1%) | 857(42.8%) | 688(34.4%) | 2001 | |
| Pastries | 0(0%) | 1(1.9%) | 3(5.6%) | 18(33.3%) | 32(59.3%) | 54 | |
| Composite foods | 172(7.5%) | 446(19.5%) | 955(41.8%) | 638(27.9%) | 76(3.3%) | 2287 | |
| One-dish meals | 159(8.4%) | 388(20.4%) | 796(41.8%) | 489(25.7%) | 72(3.8%) | 1904 | |
| Pizza pies and quiches | 9(2.9%) | 46(14.9%) | 141(45.8%) | 110(35.7%) | 2(0.6%) | 308 | |
| Sandwiches | 4(5.3%) | 12(16%) | 18(24%) | 39(52%) | 2(2.7%) | 75 | |
| Beverages | 596(24.9%) | 197(8.2%) | 497(20.8%) | 343(14.4%) | 757(31.7%) | 2390 | |
| Waters | 594(100%) | 0(0%) | 0(0%) | 0(0%) | 0(0%) | 594 | |
| Teas and herbal teas and coffees | 0(0%) | 2(3.8%) | 5(9.4%) | 26(49.1%) | 20(37.7%) | 53 | |
| Fruit juices | 0(0%) | 56(11.1%) | 357(71%) | 51(10.1%) | 39(7.8%) | 503 | |
| Fruit nectars | 0(0%) | 0(0%) | 0(0%) | 4(22.2%) | 14(77.8%) | 18 | |
| Artificially sweetened beverages | 1(0.4%) | 115(40.6%) | 81(28.6%) | 49(17.3%) | 37(13.1%) | 283 | |
| Sweetened beverages | 1(0.1%) | 24(2.6%) | 54(5.8%) | 213(22.7%) | 647(68.9%) | 939 | |
| Sum | 4980(18.4%) | 3576(13.2%) | 5837(21.5%) | 7589(28%) | 5109(18.9%) | 27091 |
Page break
Results for Italy
For Italy, the OpenFoodFact table included 16077 foods. From this list, 9327 products could not be affected to a specific food group and were deleted from the list. Then, 773 products were removed because the nutritional informations necessary to the calculation of the NutriScore were missing. 10 products were deleted after additionnal quality controls. Finally, the OpenFoodFact table used for this document included 5967 foods. The database contained 284 products composed mainly of fruits and vegetables, 1249 bread and cereal products, 419 meat, fish and eggs products, 1205 milk and dairy, 454 fats and sauces, 340 composite dishes, 1472 sugary snacks, 155 salty snacks. Overall, the mean FSAm-NSP score was 7.9+/- 8.8 points.
The overall distribution of the FSAm-NSP score is represented in Figure 1.
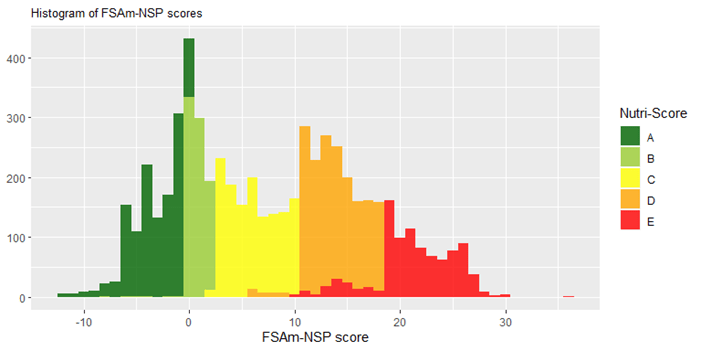
Figure 1: Overall distribution of the FSAm-NSP score
The distribution of the Nutri-Score in the different food groups is represented in Figures 2, 3 and 4.

Figure 2: Distribution of the FSAm-NSP score for solid foods.
Vertical lines represent the cut-offs of the 5-category Nutriscore. The boundary of the box nearest to the left indicates the 25th percentile, the line within the box marks the median, and the boundary of the box furthest from the left indicates the 75th percentile. Whiskers (error bars) left and right of the box indicate the lower limit (25th percentile – 1.5 * (Inter-quartile range) and the upper limit (75th percentile + 1.5 * (Inter-quartile range)). The circles are individual outlier points. *Products containing mainly fruits and vegetables
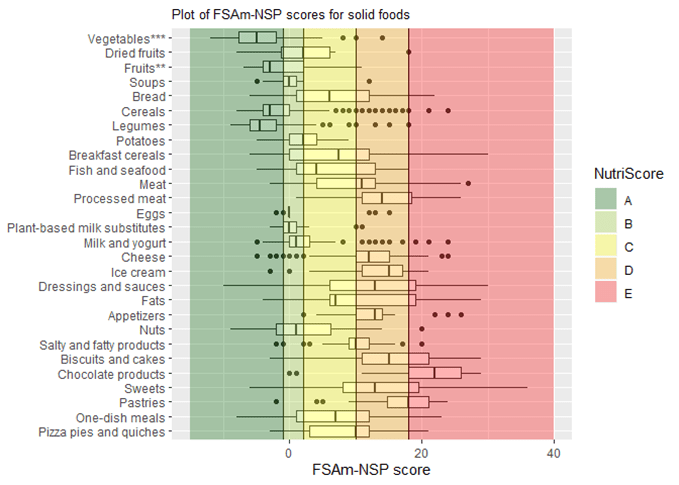
Figure 3: Distribution of the FSAm-NSP score for solid foods in subgroups containing more than 20 items.
Vertical lines represent the cut-offs of the 5-category Nutriscore. The boundary of the box nearest to the left indicates the 25th percentile, the line within the box marks the median, and the boundary of the box furthest from the left indicates the 75th percentile. Whiskers (error bars) left and right of the box indicate the lower limit (25th percentile – 1.5 * (Inter-quartile range) and the upper limit (75th percentile + 1.5 * (Inter-quartile range)). The circles are individual outlier points. ** Fruits based products ; *** Vegetables based products
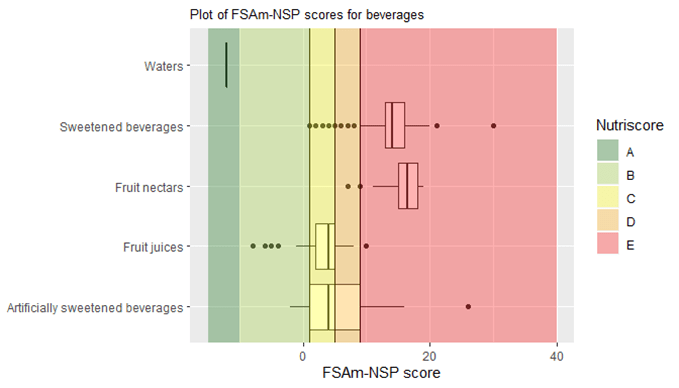
Figure 4: Distribution of the FSAm-NSP score for beverages.
Vertical lines represent the cut-offs of the 5-category Nutriscore. The boundary of the box nearest to the left indicates the 25th percentile, the line within the box marks the median, and the boundary of the box furthest from the left indicates the 75th percentile. Whiskers (error bars) left and right of the box indicate the lower limit (25th percentile – 1.5 * (Inter-quartile range) and the upper limit (75th percentile + 1.5 * (Inter-quartile range)). The circles are individual outlier points. By definition, only water is classified as A and is shown at the top of the plot.
The distribution of the Nutri-Score within the different food groups is displayed in Table 1.
Table 1: Distribution of the Nutri-Score within the different food groups. ** Fruits based products ; *** Vegetables based products.
| A | B | C | D | E | Total | ||
| Fruits and vegetables* | 191(67.3%) | 54(19%) | 34(12%) | 4(1.4%) | 1(0.4%) | 284 | |
| Vegetables*** | 133(80.1%) | 19(11.4%) | 12(7.2%) | 1(0.6%) | 1(0.6%) | 166 | |
| Dried fruits | 11(34.4%) | 9(28.1%) | 11(34.4%) | 1(3.1%) | 0(0%) | 32 | |
| Fruits** | 41(63.1%) | 12(18.5%) | 11(16.9%) | 1(1.5%) | 0(0%) | 65 | |
| Soups | 6(28.6%) | 14(66.7%) | 0(0%) | 1(4.8%) | 0(0%) | 21 | |
| Cereals and potatoes | 630(50.4%) | 166(13.3%) | 233(18.7%) | 204(16.3%) | 16(1.3%) | 1249 | |
| Bread | 47(16.6%) | 56(19.8%) | 86(30.4%) | 89(31.4%) | 5(1.8%) | 283 | |
| Cereals | 426(74.9%) | 64(11.2%) | 42(7.4%) | 33(5.8%) | 4(0.7%) | 569 | |
| Legumes | 93(81.6%) | 12(10.5%) | 6(5.3%) | 3(2.6%) | 0(0%) | 114 | |
| Potatoes | 7(22.6%) | 9(29%) | 15(48.4%) | 0(0%) | 0(0%) | 31 | |
| Breakfast cereals | 57(22.6%) | 25(9.9%) | 84(33.3%) | 79(31.3%) | 7(2.8%) | 252 | |
| Fish Meat Eggs | 36(8.6%) | 72(17.2%) | 87(20.8%) | 180(43%) | 44(10.5%) | 419 | |
| Fish and seafood | 31(16.9%) | 38(20.8%) | 37(20.2%) | 77(42.1%) | 0(0%) | 183 | |
| Meat | 1(1.6%) | 7(11.3%) | 19(30.6%) | 27(43.5%) | 8(12.9%) | 62 | |
| Processed meat | 0(0%) | 3(2.1%) | 31(21.7%) | 73(51%) | 36(25.2%) | 143 | |
| Eggs | 4(12.9%) | 24(77.4%) | 0(0%) | 3(9.7%) | 0(0%) | 31 | |
| Milk and dairy products | 191(15.9%) | 366(30.4%) | 290(24.1%) | 319(26.5%) | 39(3.2%) | 1205 | |
| Plant-based milk substitutes | 39(30.7%) | 79(62.2%) | 8(6.3%) | 1(0.8%) | 0(0%) | 127 | |
| Milk and yogurt | 139(23.4%) | 271(45.5%) | 153(25.7%) | 26(4.4%) | 6(1%) | 595 | |
| Cheese | 7(1.8%) | 15(3.9%) | 104(27.3%) | 232(60.9%) | 23(6%) | 381 | |
| Dairy desserts | 5(31.2%) | 0(0%) | 6(37.5%) | 5(31.2%) | 0(0%) | 16 | |
| Ice cream | 1(1.2%) | 1(1.2%) | 19(22.1%) | 55(64%) | 10(11.6%) | 86 | |
| Fat and sauces | 30(6.6%) | 26(5.7%) | 143(31.5%) | 126(27.8%) | 129(28.4%) | 454 | |
| Dressings and sauces | 28(9.2%) | 25(8.3%) | 61(20.1%) | 103(34%) | 86(28.4%) | 303 | |
| Fats | 2(1.3%) | 1(0.7%) | 82(54.3%) | 23(15.2%) | 43(28.5%) | 151 | |
| Salty snacks | 21(13.5%) | 6(3.9%) | 62(40%) | 60(38.7%) | 6(3.9%) | 155 | |
| Appetizers | 0(0%) | 1(1.9%) | 17(32.1%) | 31(58.5%) | 4(7.5%) | 53 | |
| Nuts | 19(43.2%) | 4(9.1%) | 18(40.9%) | 2(4.5%) | 1(2.3%) | 44 | |
| Salty and fatty products | 2(3.4%) | 1(1.7%) | 27(46.6%) | 27(46.6%) | 1(1.7%) | 58 | |
| Sugary snacks | 28(1.9%) | 43(2.9%) | 284(19.3%) | 575(39.1%) | 542(36.8%) | 1472 | |
| Biscuits and cakes | 11(1.6%) | 10(1.4%) | 140(20.3%) | 303(43.8%) | 227(32.9%) | 691 | |
| Chocolate products | 0(0%) | 2(1%) | 0(0%) | 60(28.6%) | 148(70.5%) | 210 | |
| Sweets | 16(3.2%) | 31(6.3%) | 135(27.3%) | 181(36.6%) | 132(26.7%) | 495 | |
| Pastries | 1(1.3%) | 0(0%) | 9(11.8%) | 31(40.8%) | 35(46.1%) | 76 | |
| Composite foods | 36(10.6%) | 59(17.4%) | 113(33.2%) | 118(34.7%) | 14(4.1%) | 340 | |
| One-dish meals | 32(12.2%) | 49(18.7%) | 86(32.8%) | 86(32.8%) | 9(3.4%) | 262 | |
| Pizza pies and quiches | 2(2.9%) | 10(14.5%) | 23(33.3%) | 29(42%) | 5(7.2%) | 69 | |
| Sandwiches | 2(22.2%) | 0(0%) | 4(44.4%) | 3(33.3%) | 0(0%) | 9 | |
| Beverages | 99(25.4%) | 29(7.5%) | 77(19.8%) | 36(9.3%) | 148(38%) | 389 | |
| Waters | 97(100%) | 0(0%) | 0(0%) | 0(0%) | 0(0%) | 97 | |
| Teas and herbal teas and coffees | 0(0%) | 1(25%) | 0(0%) | 1(25%) | 2(50%) | 4 | |
| Fruit juices | 2(2.3%) | 13(15.1%) | 57(66.3%) | 13(15.1%) | 1(1.2%) | 86 | |
| Fruit nectars | 0(0%) | 0(0%) | 0(0%) | 2(7.7%) | 24(92.3%) | 26 | |
| Artificially sweetened beverages | 0(0%) | 14(30.4%) | 10(21.7%) | 14(30.4%) | 8(17.4%) | 46 | |
| Sweetened beverages | 0(0%) | 1(0.8%) | 10(7.7%) | 6(4.6%) | 113(86.9%) | 130 | |
| Sum | 1262(21.1%) | 821(13.8%) | 1323(22.2%) | 1622(27.2%) | 939(15.7%) | 5967 |
Page break
Results for the Netherlands
For the Netherlands, the OpenFoodFact table included 7872 foods. From this list, 5223 products could not be affected to a specific food group and were deleted from the list. Then, 315 products were removed because the nutritional informations necessary to the calculation of the NutriScore were missing. 8 products were deleted after additionnal quality controls. Finally, the OpenFoodFact table used for this document included 2326 foods. The database contained 131 products composed mainly of fruits and vegetables, 451 bread and cereal products, 106 meat, fish and eggs products, 375 milk and dairy, 226 fats and sauces, 155 composite dishes, 563 sugary snacks, 140 salty snacks. Overall, the mean FSAm-NSP score was 8.1+/- 9.3 points.
The overall distribution of the FSAm-NSP score is represented in Figure 1.
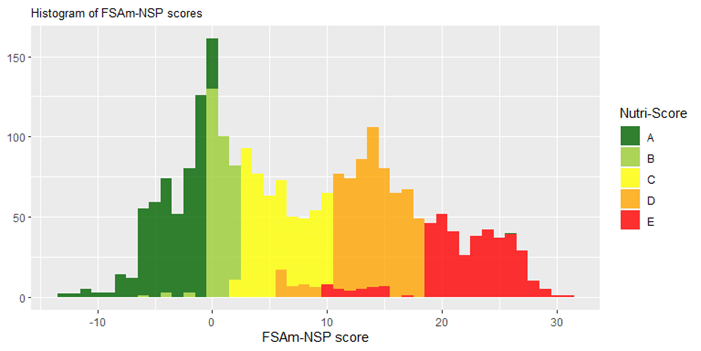
Figure 1: Overall distribution of the FSAm-NSP score
The distribution of the Nutri-Score in the different food groups is represented in Figures 2, 3 and 4.

Figure 2: Distribution of the FSAm-NSP score for solid foods.
Vertical lines represent the cut-offs of the 5-category Nutriscore. The boundary of the box nearest to the left indicates the 25th percentile, the line within the box marks the median, and the boundary of the box furthest from the left indicates the 75th percentile. Whiskers (error bars) left and right of the box indicate the lower limit (25th percentile – 1.5 * (Inter-quartile range) and the upper limit (75th percentile + 1.5 * (Inter-quartile range)). The circles are individual outlier points. *Products containing mainly fruits and vegetables
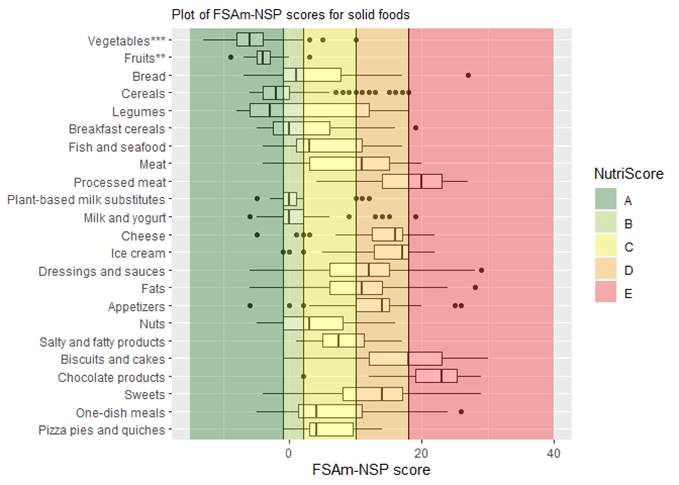
Figure 3: Distribution of the FSAm-NSP score for solid foods in subgroups containing more than 20 items.
Vertical lines represent the cut-offs of the 5-category Nutriscore. The boundary of the box nearest to the left indicates the 25th percentile, the line within the box marks the median, and the boundary of the box furthest from the left indicates the 75th percentile. Whiskers (error bars) left and right of the box indicate the lower limit (25th percentile – 1.5 * (Inter-quartile range) and the upper limit (75th percentile + 1.5 * (Inter-quartile range)). The circles are individual outlier points. ** Fruits based products ; *** Vegetables based products
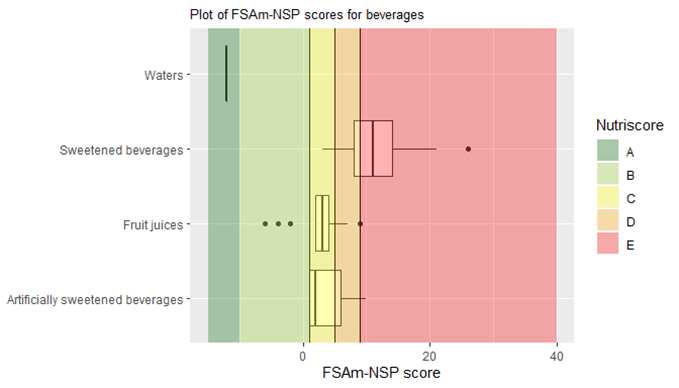
Figure 4: Distribution of the FSAm-NSP score for beverages.
Vertical lines represent the cut-offs of the 5-category Nutriscore. The boundary of the box nearest to the left indicates the 25th percentile, the line within the box marks the median, and the boundary of the box furthest from the left indicates the 75th percentile. Whiskers (error bars) left and right of the box indicate the lower limit (25th percentile – 1.5 * (Inter-quartile range) and the upper limit (75th percentile + 1.5 * (Inter-quartile range)). The circles are individual outlier points. By definition, only water is classified as A and is shown at the top of the plot.
The distribution of the Nutri-Score within the different food groups is displayed in Table 1.
Table 1: Distribution of the Nutri-Score within the different food groups. ** Fruits based products ; *** Vegetables based products.
| A | B | C | D | E | Total | ||
| Fruits and vegetables* | 92(70.2%) | 18(13.7%) | 19(14.5%) | 2(1.5%) | 0(0%) | 131 | |
| Vegetables*** | 60(87%) | 6(8.7%) | 3(4.3%) | 0(0%) | 0(0%) | 69 | |
| Dried fruits | 1(6.2%) | 5(31.2%) | 8(50%) | 2(12.5%) | 0(0%) | 16 | |
| Fruits** | 30(90.9%) | 2(6.1%) | 1(3%) | 0(0%) | 0(0%) | 33 | |
| Soups | 1(7.7%) | 5(38.5%) | 7(53.8%) | 0(0%) | 0(0%) | 13 | |
| Cereals and potatoes | 232(51.4%) | 69(15.3%) | 88(19.5%) | 60(13.3%) | 2(0.4%) | 451 | |
| Bread | 35(33%) | 28(26.4%) | 26(24.5%) | 16(15.1%) | 1(0.9%) | 106 | |
| Cereals | 106(67.5%) | 19(12.1%) | 20(12.7%) | 12(7.6%) | 0(0%) | 157 | |
| Legumes | 47(56.6%) | 3(3.6%) | 9(10.8%) | 24(28.9%) | 0(0%) | 83 | |
| Potatoes | 4(40%) | 3(30%) | 3(30%) | 0(0%) | 0(0%) | 10 | |
| Breakfast cereals | 40(42.1%) | 16(16.8%) | 30(31.6%) | 8(8.4%) | 1(1.1%) | 95 | |
| Fish Meat Eggs | 9(8.5%) | 16(15.1%) | 19(17.9%) | 37(34.9%) | 25(23.6%) | 106 | |
| Fish and seafood | 4(9.3%) | 15(34.9%) | 11(25.6%) | 13(30.2%) | 0(0%) | 43 | |
| Meat | 4(16%) | 1(4%) | 6(24%) | 11(44%) | 3(12%) | 25 | |
| Processed meat | 0(0%) | 0(0%) | 2(5.4%) | 13(35.1%) | 22(59.5%) | 37 | |
| Eggs | 1(100%) | 0(0%) | 0(0%) | 0(0%) | 0(0%) | 1 | |
| Milk and dairy products | 88(23.5%) | 118(31.5%) | 49(13.1%) | 106(28.3%) | 14(3.7%) | 375 | |
| Plant-based milk substitutes | 26(33.3%) | 45(57.7%) | 3(3.8%) | 4(5.1%) | 0(0%) | 78 | |
| Milk and yogurt | 55(36.4%) | 64(42.4%) | 23(15.2%) | 8(5.3%) | 1(0.7%) | 151 | |
| Cheese | 2(2%) | 6(6.1%) | 12(12.1%) | 71(71.7%) | 8(8.1%) | 99 | |
| Dairy desserts | 4(36.4%) | 0(0%) | 7(63.6%) | 0(0%) | 0(0%) | 11 | |
| Ice cream | 1(2.8%) | 3(8.3%) | 4(11.1%) | 23(63.9%) | 5(13.9%) | 36 | |
| Fat and sauces | 14(6.2%) | 12(5.3%) | 63(27.9%) | 103(45.6%) | 34(15%) | 226 | |
| Dressings and sauces | 11(6.9%) | 11(6.9%) | 39(24.4%) | 77(48.1%) | 22(13.8%) | 160 | |
| Fats | 3(4.5%) | 1(1.5%) | 24(36.4%) | 26(39.4%) | 12(18.2%) | 66 | |
| Salty snacks | 18(12.9%) | 13(9.3%) | 55(39.3%) | 48(34.3%) | 6(4.3%) | 140 | |
| Appetizers | 1(2.4%) | 2(4.9%) | 8(19.5%) | 24(58.5%) | 6(14.6%) | 41 | |
| Nuts | 17(30.9%) | 9(16.4%) | 20(36.4%) | 9(16.4%) | 0(0%) | 55 | |
| Salty and fatty products | 0(0%) | 2(4.5%) | 27(61.4%) | 15(34.1%) | 0(0%) | 44 | |
| Sugary snacks | 8(1.4%) | 19(3.4%) | 77(13.7%) | 189(33.6%) | 270(48%) | 563 | |
| Biscuits and cakes | 1(0.5%) | 6(3.1%) | 26(13.5%) | 64(33.3%) | 95(49.5%) | 192 | |
| Chocolate products | 0(0%) | 1(0.6%) | 0(0%) | 31(19.4%) | 128(80%) | 160 | |
| Sweets | 7(3.4%) | 12(5.8%) | 50(24.2%) | 92(44.4%) | 46(22.2%) | 207 | |
| Pastries | 0(0%) | 0(0%) | 1(25%) | 2(50%) | 1(25%) | 4 | |
| Composite foods | 19(12.3%) | 25(16.1%) | 73(47.1%) | 31(20%) | 7(4.5%) | 155 | |
| One-dish meals | 13(11.4%) | 22(19.3%) | 49(43%) | 23(20.2%) | 7(6.1%) | 114 | |
| Pizza pies and quiches | 1(3.7%) | 1(3.7%) | 20(74.1%) | 5(18.5%) | 0(0%) | 27 | |
| Sandwiches | 5(35.7%) | 2(14.3%) | 4(28.6%) | 3(21.4%) | 0(0%) | 14 | |
| Beverages | 32(17.9%) | 18(10.1%) | 46(25.7%) | 38(21.2%) | 45(25.1%) | 179 | |
| Waters | 31(100%) | 0(0%) | 0(0%) | 0(0%) | 0(0%) | 31 | |
| Teas and herbal teas and coffees | 0(0%) | 0(0%) | 3(16.7%) | 9(50%) | 6(33.3%) | 18 | |
| Fruit juices | 0(0%) | 6(14%) | 30(69.8%) | 7(16.3%) | 0(0%) | 43 | |
| Fruit nectars | 0(0%) | 0(0%) | 0(0%) | 0(0%) | 1(100%) | 1 | |
| Artificially sweetened beverages | 0(0%) | 12(48%) | 5(20%) | 7(28%) | 1(4%) | 25 | |
| Sweetened beverages | 1(1.6%) | 0(0%) | 8(13.1%) | 15(24.6%) | 37(60.7%) | 61 | |
| Sum | 512(22%) | 308(13.2%) | 489(21%) | 614(26.4%) | 403(17.3%) | 2326 |
Page break
Results for Poland
For the Poland, the OpenFoodFact table included 4739 foods. From this list, 2483 products could not be affected to a specific food group and were deleted from the list. Then, 192 products were removed because the nutritional informations necessary to the calculation of the NutriScore were missing. 1 products were deleted after additionnal quality controls. Finally, the OpenFoodFact table used for this document included 2063 foods. The database contained 99 products composed mainly of fruits and vegetables, 261 bread and cereal products, 155 meat, fish and eggs products, 507 milk and dairy, 280 fats and sauces, 96 composite dishes, 327 sugary snacks, 130 salty snacks. Overall, the mean FSAm-NSP score was 8.8+/- 8.8 points.
The overall distribution of the FSAm-NSP score is represented in Figure 1.
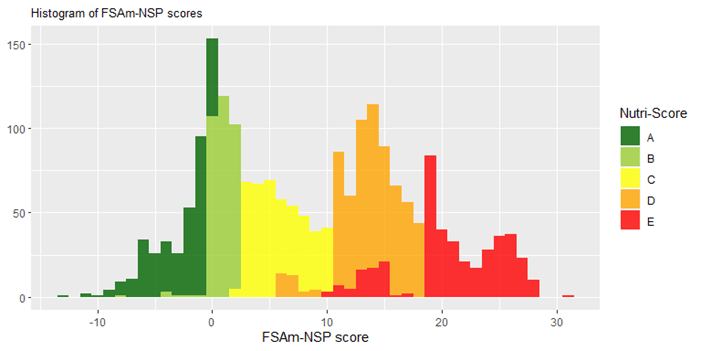
Figure 1: Overall distribution of the FSAm-NSP score
The distribution of the Nutri-Score in the different food groups is represented in Figures 2, 3 and 4.

Figure 2: Distribution of the FSAm-NSP score for solid foods.
Vertical lines represent the cut-offs of the 5-category Nutriscore. The boundary of the box nearest to the left indicates the 25th percentile, the line within the box marks the median, and the boundary of the box furthest from the left indicates the 75th percentile. Whiskers (error bars) left and right of the box indicate the lower limit (25th percentile – 1.5 * (Inter-quartile range) and the upper limit (75th percentile + 1.5 * (Inter-quartile range)). The circles are individual outlier points. *Products containing mainly fruits and vegetables
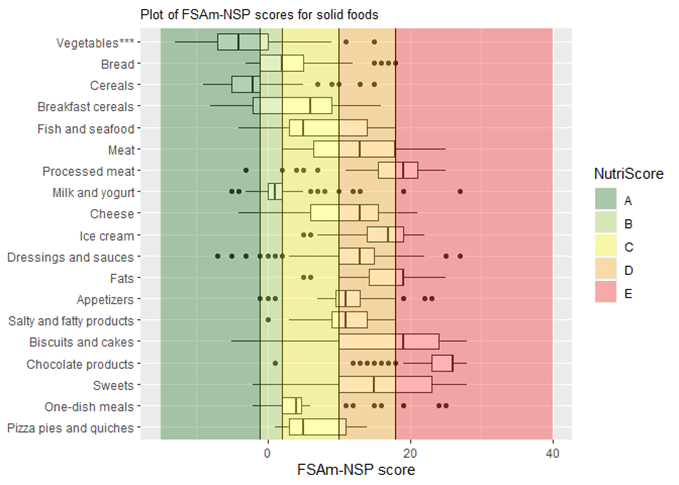
Figure 3: Distribution of the FSAm-NSP score for solid foods in subgroups containing more than 20 items.
Vertical lines represent the cut-offs of the 5-category Nutriscore. The boundary of the box nearest to the left indicates the 25th percentile, the line within the box marks the median, and the boundary of the box furthest from the left indicates the 75th percentile. Whiskers (error bars) left and right of the box indicate the lower limit (25th percentile – 1.5 * (Inter-quartile range) and the upper limit (75th percentile + 1.5 * (Inter-quartile range)). The circles are individual outlier points. ** Fruits based products ; *** Vegetables based products
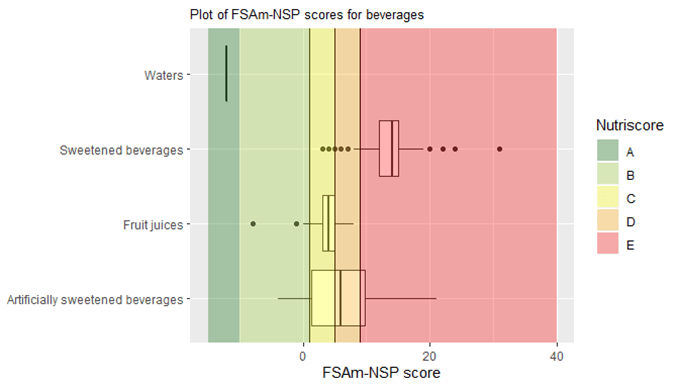
Figure 4: Distribution of the FSAm-NSP score for beverages.
Vertical lines represent the cut-offs of the 5-category Nutriscore. The boundary of the box nearest to the left indicates the 25th percentile, the line within the box marks the median, and the boundary of the box furthest from the left indicates the 75th percentile. Whiskers (error bars) left and right of the box indicate the lower limit (25th percentile – 1.5 * (Inter-quartile range) and the upper limit (75th percentile + 1.5 * (Inter-quartile range)). The circles are individual outlier points. By definition, only water is classified as A and is shown at the top of the plot.
The distribution of the Nutri-Score within the different food groups is displayed in Table 1.
Table 1: Distribution of the Nutri-Score within the different food groups. ** Fruits based products ; *** Vegetables based products.
| A | B | C | D | E | Total | ||
| Fruits and vegetables* | 55(55.6%) | 27(27.3%) | 14(14.1%) | 3(3%) | 0(0%) | 99 | |
| Vegetables*** | 39(63.9%) | 14(23%) | 6(9.8%) | 2(3.3%) | 0(0%) | 61 | |
| Dried fruits | 2(13.3%) | 9(60%) | 4(26.7%) | 0(0%) | 0(0%) | 15 | |
| Fruits** | 13(81.2%) | 1(6.2%) | 2(12.5%) | 0(0%) | 0(0%) | 16 | |
| Soups | 1(14.3%) | 3(42.9%) | 2(28.6%) | 1(14.3%) | 0(0%) | 7 | |
| Cereals and potatoes | 152(58.2%) | 31(11.9%) | 58(22.2%) | 18(6.9%) | 2(0.8%) | 261 | |
| Bread | 18(31.6%) | 14(24.6%) | 19(33.3%) | 6(10.5%) | 0(0%) | 57 | |
| Cereals | 97(83.6%) | 7(6%) | 10(8.6%) | 2(1.7%) | 0(0%) | 116 | |
| Legumes | 12(60%) | 2(10%) | 1(5%) | 3(15%) | 2(10%) | 20 | |
| Potatoes | 2(50%) | 1(25%) | 1(25%) | 0(0%) | 0(0%) | 4 | |
| Breakfast cereals | 23(35.9%) | 7(10.9%) | 27(42.2%) | 7(10.9%) | 0(0%) | 64 | |
| Fish Meat Eggs | 9(5.8%) | 15(9.7%) | 38(24.5%) | 64(41.3%) | 29(18.7%) | 155 | |
| Fish and seafood | 2(2.8%) | 11(15.5%) | 28(39.4%) | 30(42.3%) | 0(0%) | 71 | |
| Meat | 0(0%) | 3(10%) | 5(16.7%) | 18(60%) | 4(13.3%) | 30 | |
| Processed meat | 1(2.1%) | 1(2.1%) | 4(8.5%) | 16(34%) | 25(53.2%) | 47 | |
| Eggs | 6(85.7%) | 0(0%) | 1(14.3%) | 0(0%) | 0(0%) | 7 | |
| Milk and dairy products | 55(10.8%) | 196(38.7%) | 73(14.4%) | 147(29%) | 36(7.1%) | 507 | |
| Plant-based milk substitutes | 3(21.4%) | 10(71.4%) | 1(7.1%) | 0(0%) | 0(0%) | 14 | |
| Milk and yogurt | 34(13.3%) | 171(66.8%) | 40(15.6%) | 9(3.5%) | 2(0.8%) | 256 | |
| Cheese | 14(10.7%) | 14(10.7%) | 17(13%) | 79(60.3%) | 7(5.3%) | 131 | |
| Dairy desserts | 4(28.6%) | 1(7.1%) | 6(42.9%) | 3(21.4%) | 0(0%) | 14 | |
| Ice cream | 0(0%) | 0(0%) | 9(9.8%) | 56(60.9%) | 27(29.3%) | 92 | |
| Fat and sauces | 7(2.5%) | 4(1.4%) | 54(19.3%) | 151(53.9%) | 64(22.9%) | 280 | |
| Dressings and sauces | 7(3.6%) | 4(2.1%) | 43(22.2%) | 134(69.1%) | 6(3.1%) | 194 | |
| Fats | 0(0%) | 0(0%) | 11(12.8%) | 17(19.8%) | 58(67.4%) | 86 | |
| Salty snacks | 3(2.3%) | 5(3.8%) | 43(33.1%) | 76(58.5%) | 3(2.3%) | 130 | |
| Appetizers | 1(1.8%) | 2(3.6%) | 16(29.1%) | 33(60%) | 3(5.5%) | 55 | |
| Nuts | 2(15.4%) | 2(15.4%) | 3(23.1%) | 6(46.2%) | 0(0%) | 13 | |
| Salty and fatty products | 0(0%) | 1(1.6%) | 24(38.7%) | 37(59.7%) | 0(0%) | 62 | |
| Sugary snacks | 4(1.2%) | 9(2.8%) | 52(15.9%) | 79(24.2%) | 183(56%) | 327 | |
| Biscuits and cakes | 3(3.1%) | 1(1%) | 21(21.9%) | 22(22.9%) | 49(51%) | 96 | |
| Chocolate products | 0(0%) | 1(1.2%) | 0(0%) | 10(12.3%) | 70(86.4%) | 81 | |
| Sweets | 1(0.7%) | 7(4.8%) | 31(21.4%) | 44(30.3%) | 62(42.8%) | 145 | |
| Pastries | 0(0%) | 0(0%) | 0(0%) | 3(60%) | 2(40%) | 5 | |
| Composite foods | 3(3.1%) | 27(28.1%) | 48(50%) | 14(14.6%) | 4(4.2%) | 96 | |
| One-dish meals | 3(4.3%) | 21(30%) | 38(54.3%) | 5(7.1%) | 3(4.3%) | 70 | |
| Pizza pies and quiches | 0(0%) | 6(24%) | 10(40%) | 9(36%) | 0(0%) | 25 | |
| Sandwiches | 0(0%) | 0(0%) | 0(0%) | 0(0%) | 1(100%) | 1 | |
| Beverages | 46(22.1%) | 16(7.7%) | 32(15.4%) | 33(15.9%) | 81(38.9%) | 208 | |
| Waters | 46(100%) | 0(0%) | 0(0%) | 0(0%) | 0(0%) | 46 | |
| Teas and herbal teas and coffees | 0(0%) | 1(33.3%) | 0(0%) | 2(66.7%) | 0(0%) | 3 | |
| Fruit juices | 0(0%) | 6(16.7%) | 22(61.1%) | 8(22.2%) | 0(0%) | 36 | |
| Fruit nectars | 0(0%) | 0(0%) | 0(0%) | 0(0%) | 2(100%) | 2 | |
| Artificially sweetened beverages | 0(0%) | 9(26.5%) | 6(17.6%) | 10(29.4%) | 9(26.5%) | 34 | |
| Sweetened beverages | 0(0%) | 0(0%) | 4(4.6%) | 13(14.9%) | 70(80.5%) | 87 | |
| Sum | 334(16.2%) | 330(16%) | 412(20%) | 585(28.4%) | 402(19.5%) | 2063 |
Page break
Results for Portugal
For the Portugal, the OpenFoodFact table included 3792 foods. From this list, 2235 products could not be affected to a specific food group and were deleted from the list. Then, 182 products were removed because the nutritional informations necessary to the calculation of the NutriScore were missing. 2 products were deleted after additionnal quality controls. Finally, the OpenFoodFact table used for this document included 1373 foods. The database contained 59 products composed mainly of fruits and vegetables, 267 bread and cereal products, 71 meat, fish and eggs products, 289 milk and dairy, 95 fats and sauces, 45 composite dishes, 325 sugary snacks, 71 salty snacks. Overall, the mean FSAm-NSP score was 8+/- 8.7 points.
The overall distribution of the FSAm-NSP score is represented in Figure 1.
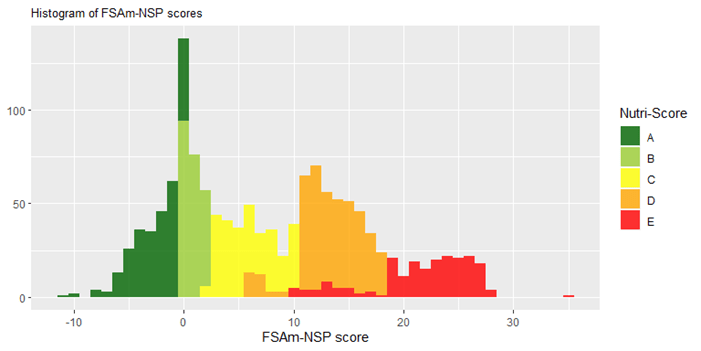
Figure 1: Overall distribution of the FSAm-NSP score
The distribution of the Nutri-Score in the different food groups is represented in Figures 2, 3 and 4.
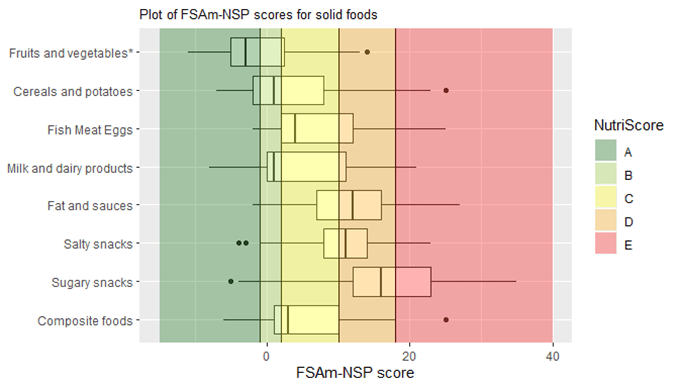
Figure 2: Distribution of the FSAm-NSP score for solid foods.
Vertical lines represent the cut-offs of the 5-category Nutriscore. The boundary of the box nearest to the left indicates the 25th percentile, the line within the box marks the median, and the boundary of the box furthest from the left indicates the 75th percentile. Whiskers (error bars) left and right of the box indicate the lower limit (25th percentile – 1.5 * (Inter-quartile range) and the upper limit (75th percentile + 1.5 * (Inter-quartile range)). The circles are individual outlier points. *Products containing mainly fruits and vegetables

Figure 3: Distribution of the FSAm-NSP score for solid foods in subgroups containing more than 20 items.
Vertical lines represent the cut-offs of the 5-category Nutriscore. The boundary of the box nearest to the left indicates the 25th percentile, the line within the box marks the median, and the boundary of the box furthest from the left indicates the 75th percentile. Whiskers (error bars) left and right of the box indicate the lower limit (25th percentile – 1.5 * (Inter-quartile range) and the upper limit (75th percentile + 1.5 * (Inter-quartile range)). The circles are individual outlier points. ** Fruits based products ; *** Vegetables based products
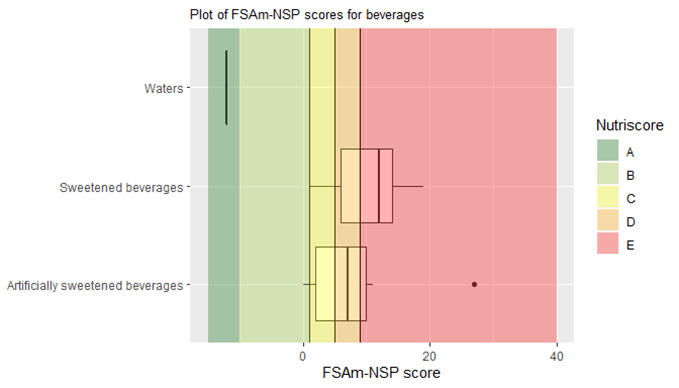
Figure 4: Distribution of the FSAm-NSP score for beverages.
Vertical lines represent the cut-offs of the 5-category Nutriscore. The boundary of the box nearest to the left indicates the 25th percentile, the line within the box marks the median, and the boundary of the box furthest from the left indicates the 75th percentile. Whiskers (error bars) left and right of the box indicate the lower limit (25th percentile – 1.5 * (Inter-quartile range) and the upper limit (75th percentile + 1.5 * (Inter-quartile range)). The circles are individual outlier points. By definition, only water is classified as A and is shown at the top of the plot.
The distribution of the Nutri-Score within the different food groups is displayed in Table 1.
Table 1: Distribution of the Nutri-Score within the different food groups. ** Fruits based products ; *** Vegetables based products.
| A | B | C | D | E | Total | ||
| Fruits and vegetables* | 35(59.3%) | 9(15.3%) | 12(20.3%) | 3(5.1%) | 0(0%) | 59 | |
| Vegetables*** | 25(78.1%) | 3(9.4%) | 3(9.4%) | 1(3.1%) | 0(0%) | 32 | |
| Dried fruits | 0(0%) | 0(0%) | 5(83.3%) | 1(16.7%) | 0(0%) | 6 | |
| Fruits** | 7(77.8%) | 0(0%) | 2(22.2%) | 0(0%) | 0(0%) | 9 | |
| Soups | 3(25%) | 6(50%) | 2(16.7%) | 1(8.3%) | 0(0%) | 12 | |
| Cereals and potatoes | 99(37.1%) | 45(16.9%) | 73(27.3%) | 44(16.5%) | 6(2.2%) | 267 | |
| Bread | 20(37%) | 11(20.4%) | 19(35.2%) | 4(7.4%) | 0(0%) | 54 | |
| Cereals | 46(53.5%) | 20(23.3%) | 15(17.4%) | 4(4.7%) | 1(1.2%) | 86 | |
| Legumes | 11(52.4%) | 1(4.8%) | 1(4.8%) | 5(23.8%) | 3(14.3%) | 21 | |
| Potatoes | 1(33.3%) | 1(33.3%) | 0(0%) | 1(33.3%) | 0(0%) | 3 | |
| Breakfast cereals | 21(20.4%) | 12(11.7%) | 38(36.9%) | 30(29.1%) | 2(1.9%) | 103 | |
| Fish Meat Eggs | 5(7%) | 15(21.1%) | 21(29.6%) | 27(38%) | 3(4.2%) | 71 | |
| Fish and seafood | 3(7.9%) | 9(23.7%) | 19(50%) | 7(18.4%) | 0(0%) | 38 | |
| Meat | 0(0%) | 0(0%) | 1(33.3%) | 2(66.7%) | 0(0%) | 3 | |
| Processed meat | 0(0%) | 2(8.3%) | 1(4.2%) | 18(75%) | 3(12.5%) | 24 | |
| Eggs | 2(33.3%) | 4(66.7%) | 0(0%) | 0(0%) | 0(0%) | 6 | |
| Milk and dairy products | 63(21.8%) | 103(35.6%) | 47(16.3%) | 71(24.6%) | 5(1.7%) | 289 | |
| Plant-based milk substitutes | 10(34.5%) | 19(65.5%) | 0(0%) | 0(0%) | 0(0%) | 29 | |
| Milk and yogurt | 44(26.7%) | 80(48.5%) | 31(18.8%) | 10(6.1%) | 0(0%) | 165 | |
| Cheese | 5(10.9%) | 3(6.5%) | 4(8.7%) | 34(73.9%) | 0(0%) | 46 | |
| Dairy desserts | 4(44.4%) | 1(11.1%) | 3(33.3%) | 1(11.1%) | 0(0%) | 9 | |
| Ice cream | 0(0%) | 0(0%) | 9(22.5%) | 26(65%) | 5(12.5%) | 40 | |
| Fat and sauces | 3(3.2%) | 7(7.4%) | 19(20%) | 47(49.5%) | 19(20%) | 95 | |
| Dressings and sauces | 1(1.8%) | 7(12.7%) | 5(9.1%) | 38(69.1%) | 4(7.3%) | 55 | |
| Fats | 2(5%) | 0(0%) | 14(35%) | 9(22.5%) | 15(37.5%) | 40 | |
| Salty snacks | 3(4.2%) | 3(4.2%) | 27(38%) | 34(47.9%) | 4(5.6%) | 71 | |
| Appetizers | 0(0%) | 1(2.4%) | 15(35.7%) | 23(54.8%) | 3(7.1%) | 42 | |
| Nuts | 3(33.3%) | 1(11.1%) | 4(44.4%) | 1(11.1%) | 0(0%) | 9 | |
| Salty and fatty products | 0(0%) | 1(5%) | 8(40%) | 10(50%) | 1(5%) | 20 | |
| Sugary snacks | 9(2.8%) | 17(5.2%) | 37(11.4%) | 128(39.4%) | 134(41.2%) | 325 | |
| Biscuits and cakes | 3(1.5%) | 8(3.9%) | 26(12.7%) | 87(42.6%) | 80(39.2%) | 204 | |
| Chocolate products | 0(0%) | 0(0%) | 2(4.1%) | 8(16.3%) | 39(79.6%) | 49 | |
| Sweets | 5(7.1%) | 9(12.9%) | 9(12.9%) | 33(47.1%) | 14(20%) | 70 | |
| Pastries | 1(50%) | 0(0%) | 0(0%) | 0(0%) | 1(50%) | 2 | |
| Composite foods | 11(24.4%) | 11(24.4%) | 14(31.1%) | 8(17.8%) | 1(2.2%) | 45 | |
| One-dish meals | 10(32.3%) | 8(25.8%) | 7(22.6%) | 5(16.1%) | 1(3.2%) | 31 | |
| Pizza pies and quiches | 0(0%) | 3(23.1%) | 7(53.8%) | 3(23.1%) | 0(0%) | 13 | |
| Sandwiches | 1(100%) | 0(0%) | 0(0%) | 0(0%) | 0(0%) | 1 | |
| Beverages | 44(29.1%) | 11(7.3%) | 22(14.6%) | 35(23.2%) | 39(25.8%) | 151 | |
| Waters | 44(100%) | 0(0%) | 0(0%) | 0(0%) | 0(0%) | 44 | |
| Teas and herbal teas and coffees | 0(0%) | 1(5.9%) | 3(17.6%) | 12(70.6%) | 1(5.9%) | 17 | |
| Fruit juices | 0(0%) | 1(7.7%) | 9(69.2%) | 3(23.1%) | 0(0%) | 13 | |
| Fruit nectars | 0(0%) | 0(0%) | 0(0%) | 3(30%) | 7(70%) | 10 | |
| Artificially sweetened beverages | 0(0%) | 6(24%) | 2(8%) | 10(40%) | 7(28%) | 25 | |
| Sweetened beverages | 0(0%) | 3(7.1%) | 8(19%) | 7(16.7%) | 24(57.1%) | 42 | |
| Sum | 272(19.8%) | 221(16.1%) | 272(19.8%) | 397(28.9%) | 211(15.4%) | 1373 |
Page break
Results for Spain
For Spain, the OpenFoodFact table included 186241 foods. From this list, 132467 products could not be affected to a specific food group and were deleted from the list. Then, 6746 products were removed because the nutritional informations necessary to the calculation of the NutriScore were missing. 19 products were deleted after additionnal quality controls. Finally, the OpenFoodFact table used for this document included 47009 foods. The database contained 4244 products composed mainly of fruits and vegetables, 6811 bread and cereal products, 6716 meat, fish and eggs products, 7868 milk and dairy, 3909 fats and sauces, 2350 composite dishes, 9555 sugary snacks, 3154 salty snacks. Overall, the mean FSAm-NSP score was 8.7+/- 8.7 points.
The overall distribution of the FSAm-NSP score is represented in Figure 1.
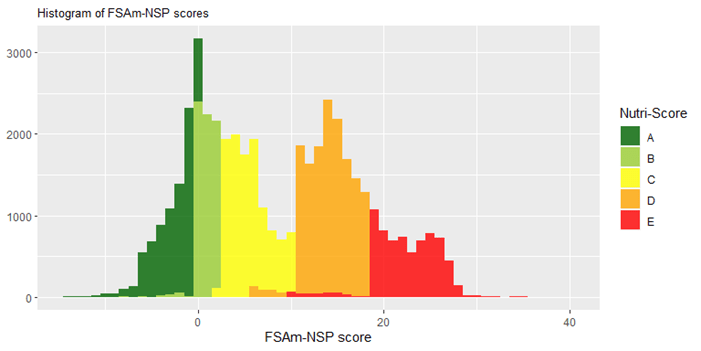
Figure 1: Overall distribution of the FSAm-NSP score
The distribution of the Nutri-Score in the different food groups is represented in Figures 2, 3 and 4.
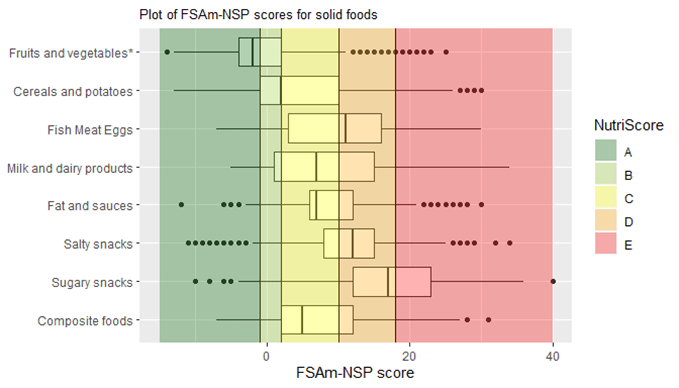
Figure 2: Distribution of the FSAm-NSP score for solid foods.
Vertical lines represent the cut-offs of the 5-category Nutriscore. The boundary of the box nearest to the left indicates the 25th percentile, the line within the box marks the median, and the boundary of the box furthest from the left indicates the 75th percentile. Whiskers (error bars) left and right of the box indicate the lower limit (25th percentile – 1.5 * (Inter-quartile range) and the upper limit (75th percentile + 1.5 * (Inter-quartile range)). The circles are individual outlier points. *Products containing mainly fruits and vegetables
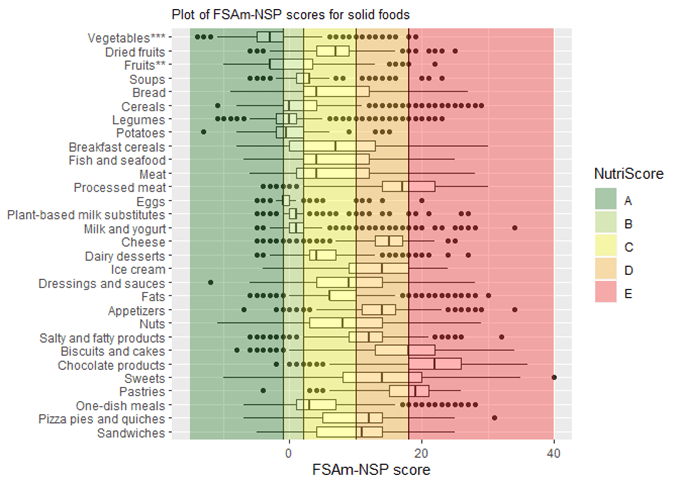
Figure 3: Distribution of the FSAm-NSP score for solid foods in subgroups containing more than 20 items.
Vertical lines represent the cut-offs of the 5-category Nutriscore. The boundary of the box nearest to the left indicates the 25th percentile, the line within the box marks the median, and the boundary of the box furthest from the left indicates the 75th percentile. Whiskers (error bars) left and right of the box indicate the lower limit (25th percentile – 1.5 * (Inter-quartile range) and the upper limit (75th percentile + 1.5 * (Inter-quartile range)). The circles are individual outlier points. ** Fruits based products ; *** Vegetables based products
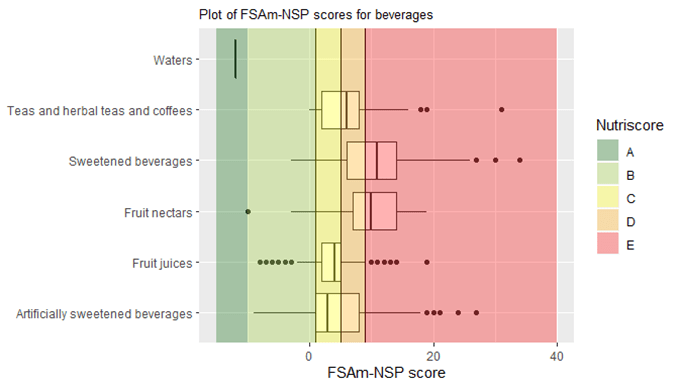
Figure 4: Distribution of the FSAm-NSP score for beverages.
Vertical lines represent the cut-offs of the 5-category Nutriscore. The boundary of the box nearest to the left indicates the 25th percentile, the line within the box marks the median, and the boundary of the box furthest from the left indicates the 75th percentile. Whiskers (error bars) left and right of the box indicate the lower limit (25th percentile – 1.5 * (Inter-quartile range) and the upper limit (75th percentile + 1.5 * (Inter-quartile range)). The circles are individual outlier points. By definition, only water is classified as A and is shown at the top of the plot.
The distribution of the Nutri-Score within the different food groups is displayed in Table 1.
Table 1: Distribution of the Nutri-Score within the different food groups. ** Fruits based products ; *** Vegetables based products.
| A | B | C | D | E | Total | ||
| Fruits and vegetables* | 2712(63.9%) | 533(12.6%) | 864(20.4%) | 121(2.9%) | 14(0.3%) | 4244 | |
| Vegetables*** | 2211(82.3%) | 251(9.3%) | 182(6.8%) | 40(1.5%) | 2(0.1%) | 2686 | |
| Dried fruits | 25(5.6%) | 50(11.3%) | 316(71.3%) | 45(10.2%) | 7(1.6%) | 443 | |
| Fruits** | 425(66.5%) | 48(7.5%) | 144(22.5%) | 20(3.1%) | 2(0.3%) | 639 | |
| Soups | 51(10.7%) | 184(38.7%) | 222(46.6%) | 16(3.4%) | 3(0.6%) | 476 | |
| Cereals and potatoes | 2143(31.5%) | 1530(22.5%) | 1444(21.2%) | 1469(21.6%) | 225(3.3%) | 6811 | |
| Bread | 235(11.6%) | 377(18.5%) | 750(36.9%) | 640(31.5%) | 32(1.6%) | 2034 | |
| Cereals | 1215(46.3%) | 639(24.4%) | 305(11.6%) | 328(12.5%) | 135(5.1%) | 2622 | |
| Legumes | 470(46.6%) | 333(33%) | 84(8.3%) | 98(9.7%) | 23(2.3%) | 1008 | |
| Potatoes | 33(50%) | 17(25.8%) | 13(19.7%) | 3(4.5%) | 0(0%) | 66 | |
| Breakfast cereals | 190(17.6%) | 164(15.2%) | 292(27%) | 400(37%) | 35(3.2%) | 1081 | |
| Fish Meat Eggs | 643(9.6%) | 962(14.3%) | 1486(22.1%) | 2460(36.6%) | 1165(17.3%) | 6716 | |
| Fish and seafood | 291(10.7%) | 622(23%) | 857(31.6%) | 913(33.7%) | 27(1%) | 2710 | |
| Meat | 225(20.2%) | 196(17.6%) | 302(27.2%) | 277(24.9%) | 112(10.1%) | 1112 | |
| Processed meat | 10(0.4%) | 66(2.5%) | 313(11.7%) | 1261(47.2%) | 1024(38.3%) | 2674 | |
| Eggs | 117(56.8%) | 73(35.4%) | 10(4.9%) | 5(2.4%) | 1(0.5%) | 206 | |
| Offals | 0(0%) | 5(35.7%) | 4(28.6%) | 4(28.6%) | 1(7.1%) | 14 | |
| Milk and dairy products | 890(11.3%) | 2104(26.7%) | 1367(17.4%) | 3098(39.4%) | 409(5.2%) | 7868 | |
| Plant-based milk substitutes | 139(21.3%) | 432(66.2%) | 51(7.8%) | 22(3.4%) | 9(1.4%) | 653 | |
| Milk and yogurt | 641(21.8%) | 1570(53.3%) | 583(19.8%) | 133(4.5%) | 20(0.7%) | 2947 | |
| Cheese | 71(2.3%) | 31(1%) | 298(9.6%) | 2502(80.5%) | 207(6.7%) | 3109 | |
| Dairy desserts | 34(8%) | 50(11.8%) | 259(61.1%) | 74(17.5%) | 7(1.7%) | 424 | |
| Ice cream | 5(0.7%) | 21(2.9%) | 176(23.9%) | 367(49.9%) | 166(22.6%) | 735 | |
| Fat and sauces | 209(5.3%) | 231(5.9%) | 2074(53.1%) | 975(24.9%) | 420(10.7%) | 3909 | |
| Dressings and sauces | 188(8.7%) | 219(10.1%) | 788(36.4%) | 734(33.9%) | 238(11%) | 2167 | |
| Fats | 21(1.2%) | 12(0.7%) | 1286(73.8%) | 241(13.8%) | 182(10.4%) | 1742 | |
| Salty snacks | 106(3.4%) | 186(5.9%) | 881(27.9%) | 1671(53%) | 310(9.8%) | 3154 | |
| Appetizers | 7(0.6%) | 25(2.2%) | 214(19.1%) | 741(66.2%) | 133(11.9%) | 1120 | |
| Nuts | 66(7.3%) | 109(12%) | 343(37.9%) | 296(32.7%) | 91(10.1%) | 905 | |
| Salty and fatty products | 33(2.9%) | 52(4.6%) | 324(28.7%) | 634(56.2%) | 86(7.6%) | 1129 | |
| Sugary snacks | 225(2.4%) | 502(5.3%) | 1214(12.7%) | 3551(37.2%) | 4063(42.5%) | 9555 | |
| Biscuits and cakes | 35(1%) | 94(2.7%) | 358(10.3%) | 1400(40.4%) | 1577(45.5%) | 3464 | |
| Chocolate products | 1(0.1%) | 4(0.3%) | 45(3%) | 379(25%) | 1084(71.6%) | 1513 | |
| Sweets | 188(4.4%) | 404(9.5%) | 789(18.5%) | 1645(38.6%) | 1239(29.1%) | 4265 | |
| Pastries | 1(0.3%) | 0(0%) | 22(7%) | 127(40.6%) | 163(52.1%) | 313 | |
| Composite foods | 225(9.6%) | 460(19.6%) | 842(35.8%) | 734(31.2%) | 89(3.8%) | 2350 | |
| One-dish meals | 198(13.1%) | 391(25.8%) | 623(41.1%) | 243(16%) | 61(4%) | 1516 | |
| Pizza pies and quiches | 5(1.2%) | 24(5.8%) | 113(27.4%) | 251(60.8%) | 20(4.8%) | 413 | |
| Sandwiches | 22(5.2%) | 45(10.7%) | 106(25.2%) | 240(57%) | 8(1.9%) | 421 | |
| Beverages | 776(32.3%) | 319(13.3%) | 544(22.6%) | 361(15%) | 402(16.7%) | 2402 | |
| Waters | 774(100%) | 0(0%) | 0(0%) | 0(0%) | 0(0%) | 774 | |
| Teas and herbal teas and coffees | 0(0%) | 16(17.2%) | 23(24.7%) | 39(41.9%) | 15(16.1%) | 93 | |
| Fruit juices | 1(0.1%) | 140(20.3%) | 409(59.4%) | 117(17%) | 21(3.1%) | 688 | |
| Fruit nectars | 0(0%) | 4(2.6%) | 15(9.7%) | 58(37.4%) | 78(50.3%) | 155 | |
| Artificially sweetened beverages | 1(0.4%) | 107(37.9%) | 56(19.9%) | 75(26.6%) | 43(15.2%) | 282 | |
| Sweetened beverages | 0(0%) | 52(12.7%) | 41(10%) | 72(17.6%) | 245(59.8%) | 410 | |
| Sum | 7929(16.9%) | 6827(14.5%) | 10716(22.8%) | 14440(30.7%) | 7097(15.1%) | 47009 |
Page break
Results for Sweden
For Sweden, the OpenFoodFact table included 3544 foods. From this list, 1220 products could not be affected to a specific food group and were deleted from the list. Then, 233 products were removed because the nutritional informations necessary to the calculation of the NutriScore were missing. 1 products were deleted after additionnal quality controls. Finally, the OpenFoodFact table used for this document included 2090 foods. The database contained 78 products composed mainly of fruits and vegetables, 273 bread and cereal products, 157 meat, fish and eggs products, 455 milk and dairy, 189 fats and sauces, 293 composite dishes, 376 sugary snacks, 114 salty snacks. Overall, the mean FSAm-NSP score was 9.1+/- 9 points.
The overall distribution of the FSAm-NSP score is represented in Figure 1.
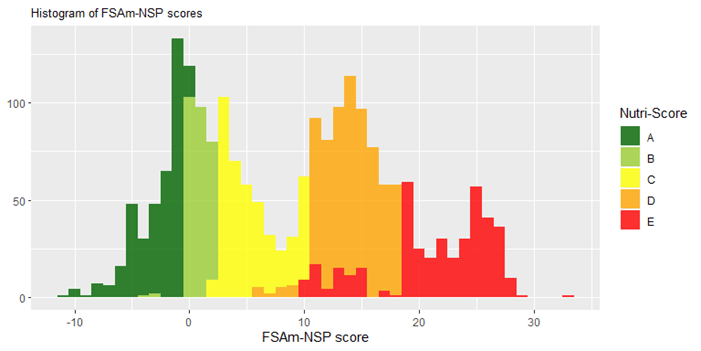
Figure 1: Overall distribution of the FSAm-NSP score
The distribution of the Nutri-Score in the different food groups is represented in Figures 2, 3 and 4.
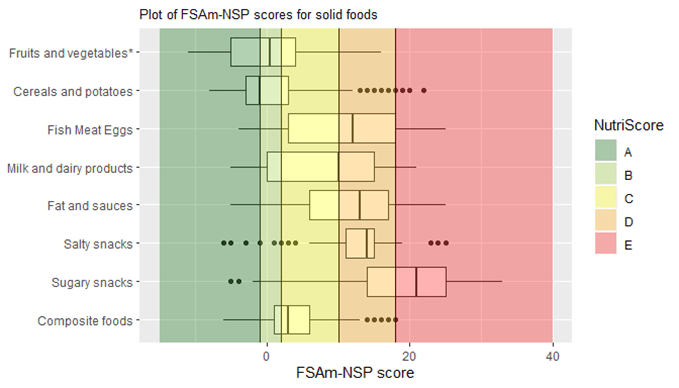
Figure 2: Distribution of the FSAm-NSP score for solid foods.
Vertical lines represent the cut-offs of the 5-category Nutriscore. The boundary of the box nearest to the left indicates the 25th percentile, the line within the box marks the median, and the boundary of the box furthest from the left indicates the 75th percentile. Whiskers (error bars) left and right of the box indicate the lower limit (25th percentile – 1.5 * (Inter-quartile range) and the upper limit (75th percentile + 1.5 * (Inter-quartile range)). The circles are individual outlier points. *Products containing mainly fruits and vegetables
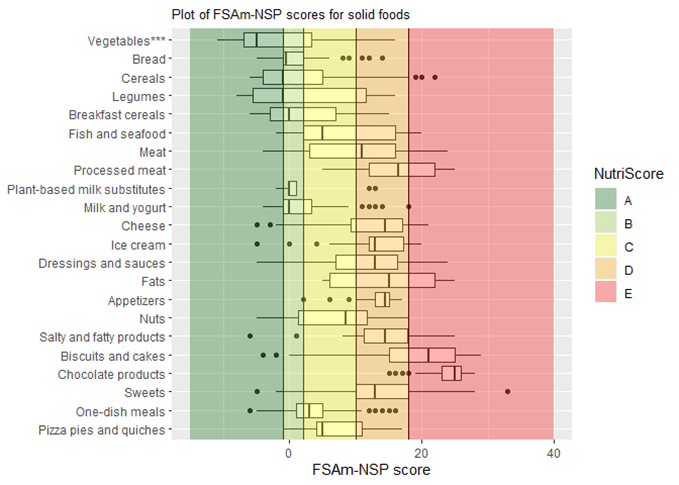
Figure 3: Distribution of the FSAm-NSP score for solid foods in subgroups containing more than 20 items.
Vertical lines represent the cut-offs of the 5-category Nutriscore. The boundary of the box nearest to the left indicates the 25th percentile, the line within the box marks the median, and the boundary of the box furthest from the left indicates the 75th percentile. Whiskers (error bars) left and right of the box indicate the lower limit (25th percentile – 1.5 * (Inter-quartile range) and the upper limit (75th percentile + 1.5 * (Inter-quartile range)). The circles are individual outlier points. ** Fruits based products ; *** Vegetables based products
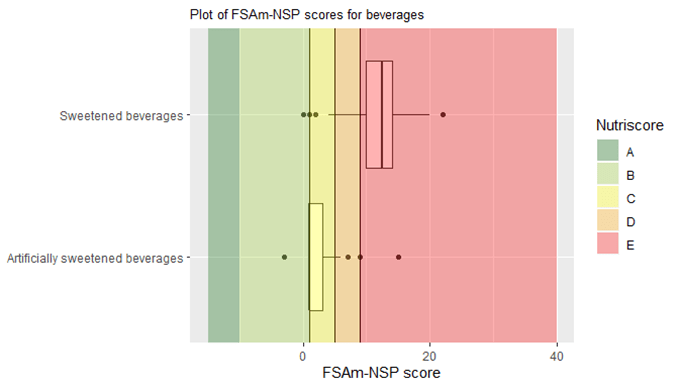
Figure 4: Distribution of the FSAm-NSP score for beverages.
Vertical lines represent the cut-offs of the 5-category Nutriscore. The boundary of the box nearest to the left indicates the 25th percentile, the line within the box marks the median, and the boundary of the box furthest from the left indicates the 75th percentile. Whiskers (error bars) left and right of the box indicate the lower limit (25th percentile – 1.5 * (Inter-quartile range) and the upper limit (75th percentile + 1.5 * (Inter-quartile range)). The circles are individual outlier points. By definition, only water is classified as A and is shown at the top of the plot.
The distribution of the Nutri-Score within the different food groups is displayed in Table 1.
Table 1: Distribution of the Nutri-Score within the different food groups. ** Fruits based products ; *** Vegetables based products.
| A | B | C | D | E | Total | ||
| Fruits and vegetables* | 38(48.7%) | 11(14.1%) | 27(34.6%) | 2(2.6%) | 0(0%) | 78 | |
| Vegetables*** | 29(65.9%) | 1(2.3%) | 12(27.3%) | 2(4.5%) | 0(0%) | 44 | |
| Dried fruits | 1(9.1%) | 3(27.3%) | 7(63.6%) | 0(0%) | 0(0%) | 11 | |
| Fruits** | 5(38.5%) | 3(23.1%) | 5(38.5%) | 0(0%) | 0(0%) | 13 | |
| Soups | 3(30%) | 4(40%) | 3(30%) | 0(0%) | 0(0%) | 10 | |
| Cereals and potatoes | 137(50.2%) | 56(20.5%) | 38(13.9%) | 34(12.5%) | 8(2.9%) | 273 | |
| Bread | 34(50%) | 20(29.4%) | 10(14.7%) | 4(5.9%) | 0(0%) | 68 | |
| Cereals | 49(53.3%) | 16(17.4%) | 6(6.5%) | 13(14.1%) | 8(8.7%) | 92 | |
| Legumes | 12(52.2%) | 1(4.3%) | 2(8.7%) | 8(34.8%) | 0(0%) | 23 | |
| Potatoes | 8(47.1%) | 5(29.4%) | 4(23.5%) | 0(0%) | 0(0%) | 17 | |
| Breakfast cereals | 34(46.6%) | 14(19.2%) | 16(21.9%) | 9(12.3%) | 0(0%) | 73 | |
| Fish Meat Eggs | 27(17.2%) | 11(7%) | 25(15.9%) | 58(36.9%) | 36(22.9%) | 157 | |
| Fish and seafood | 3(14.3%) | 3(14.3%) | 6(28.6%) | 7(33.3%) | 2(9.5%) | 21 | |
| Meat | 8(12.3%) | 8(12.3%) | 15(23.1%) | 21(32.3%) | 13(20%) | 65 | |
| Processed meat | 0(0%) | 0(0%) | 3(5.6%) | 30(55.6%) | 21(38.9%) | 54 | |
| Eggs | 16(100%) | 0(0%) | 0(0%) | 0(0%) | 0(0%) | 16 | |
| Offals | 0(0%) | 0(0%) | 1(100%) | 0(0%) | 0(0%) | 1 | |
| Milk and dairy products | 99(21.8%) | 77(16.9%) | 61(13.4%) | 196(43.1%) | 22(4.8%) | 455 | |
| Plant-based milk substitutes | 6(25%) | 16(66.7%) | 0(0%) | 2(8.3%) | 0(0%) | 24 | |
| Milk and yogurt | 67(41.9%) | 47(29.4%) | 22(13.8%) | 24(15%) | 0(0%) | 160 | |
| Cheese | 20(10.8%) | 12(6.5%) | 27(14.5%) | 116(62.4%) | 11(5.9%) | 186 | |
| Dairy desserts | 5(38.5%) | 1(7.7%) | 6(46.2%) | 1(7.7%) | 0(0%) | 13 | |
| Ice cream | 1(1.4%) | 1(1.4%) | 6(8.3%) | 53(73.6%) | 11(15.3%) | 72 | |
| Fat and sauces | 7(3.7%) | 10(5.3%) | 49(25.9%) | 84(44.4%) | 39(20.6%) | 189 | |
| Dressings and sauces | 7(4.5%) | 10(6.4%) | 36(23.1%) | 78(50%) | 25(16%) | 156 | |
| Fats | 0(0%) | 0(0%) | 13(39.4%) | 6(18.2%) | 14(42.4%) | 33 | |
| Salty snacks | 6(5.3%) | 4(3.5%) | 15(13.2%) | 82(71.9%) | 7(6.1%) | 114 | |
| Appetizers | 0(0%) | 1(1.6%) | 6(9.7%) | 55(88.7%) | 0(0%) | 62 | |
| Nuts | 5(22.7%) | 2(9.1%) | 7(31.8%) | 8(36.4%) | 0(0%) | 22 | |
| Salty and fatty products | 1(3.3%) | 1(3.3%) | 2(6.7%) | 19(63.3%) | 7(23.3%) | 30 | |
| Sugary snacks | 10(2.7%) | 11(2.9%) | 33(8.8%) | 108(28.7%) | 214(56.9%) | 376 | |
| Biscuits and cakes | 4(3.1%) | 3(2.3%) | 7(5.5%) | 35(27.3%) | 79(61.7%) | 128 | |
| Chocolate products | 0(0%) | 0(0%) | 0(0%) | 13(11.5%) | 100(88.5%) | 113 | |
| Sweets | 6(4.5%) | 8(6%) | 26(19.5%) | 60(45.1%) | 33(24.8%) | 133 | |
| Pastries | 0(0%) | 0(0%) | 0(0%) | 0(0%) | 2(100%) | 2 | |
| Composite foods | 31(10.6%) | 76(25.9%) | 142(48.5%) | 44(15%) | 0(0%) | 293 | |
| One-dish meals | 30(14.4%) | 68(32.5%) | 95(45.5%) | 16(7.7%) | 0(0%) | 209 | |
| Pizza pies and quiches | 1(1.3%) | 8(10.5%) | 44(57.9%) | 23(30.3%) | 0(0%) | 76 | |
| Sandwiches | 0(0%) | 0(0%) | 3(37.5%) | 5(62.5%) | 0(0%) | 8 | |
| Beverages | 17(11%) | 19(12.3%) | 21(13.5%) | 19(12.3%) | 79(51%) | 155 | |
| Waters | 16(100%) | 0(0%) | 0(0%) | 0(0%) | 0(0%) | 16 | |
| Teas and herbal teas and coffees | 0(0%) | 0(0%) | 0(0%) | 1(100%) | 0(0%) | 1 | |
| Fruit juices | 1(5%) | 3(15%) | 13(65%) | 1(5%) | 2(10%) | 20 | |
| Artificially sweetened beverages | 0(0%) | 13(54.2%) | 5(20.8%) | 4(16.7%) | 2(8.3%) | 24 | |
| Sweetened beverages | 0(0%) | 3(3.2%) | 3(3.2%) | 13(13.8%) | 75(79.8%) | 94 | |
| Sum | 372(17.8%) | 275(13.2%) | 411(19.7%) | 627(30%) | 405(19.4%) | 2090 |
Page break
Results for Switzerland
For Switzerland, the OpenFoodFact table included 52415 foods. From this list, 36448 products could not be affected to a specific food group and were deleted from the list. Then, 1605 products were removed because the nutritional informations necessary to the calculation of the NutriScore were missing. 21 products were deleted after additionnal quality controls. Finally, the OpenFoodFact table used for this document included 14341 foods. The database contained 946 products composed mainly of fruits and vegetables, 2274 bread and cereal products, 1213 meat, fish and eggs products, 2380 milk and dairy, 1186 fats and sauces, 1067 composite dishes, 3262 sugary snacks, 745 salty snacks. Overall, the mean FSAm-NSP score was 8.8+/- 9.1 points.
The overall distribution of the FSAm-NSP score is represented in Figure 1.
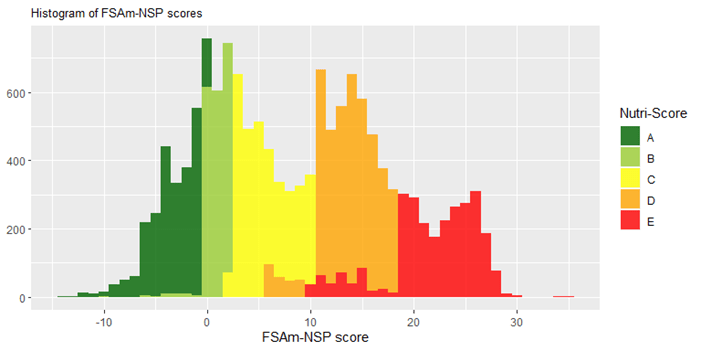
Figure 1: Overall distribution of the FSAm-NSP score
The distribution of the Nutri-Score in the different food groups is represented in Figures 2, 3 and 4.

Figure 2: Distribution of the FSAm-NSP score for solid foods.
Vertical lines represent the cut-offs of the 5-category Nutriscore. The boundary of the box nearest to the left indicates the 25th percentile, the line within the box marks the median, and the boundary of the box furthest from the left indicates the 75th percentile. Whiskers (error bars) left and right of the box indicate the lower limit (25th percentile – 1.5 * (Inter-quartile range) and the upper limit (75th percentile + 1.5 * (Inter-quartile range)). The circles are individual outlier points. *Products containing mainly fruits and vegetables
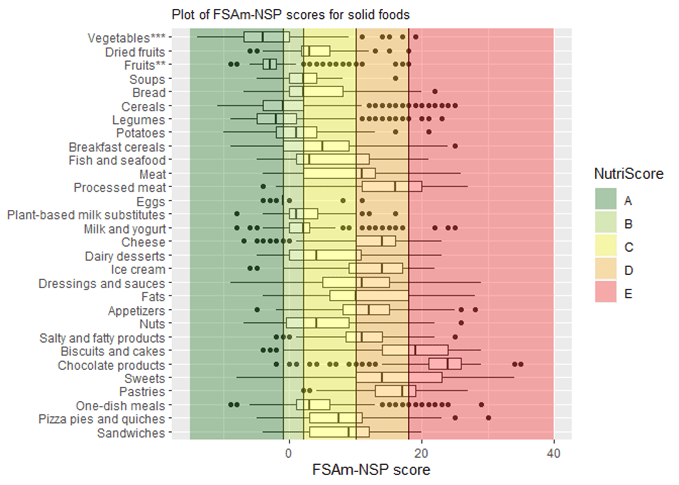
Figure 3: Distribution of the FSAm-NSP score for solid foods in subgroups containing more than 20 items.
Vertical lines represent the cut-offs of the 5-category Nutriscore. The boundary of the box nearest to the left indicates the 25th percentile, the line within the box marks the median, and the boundary of the box furthest from the left indicates the 75th percentile. Whiskers (error bars) left and right of the box indicate the lower limit (25th percentile – 1.5 * (Inter-quartile range) and the upper limit (75th percentile + 1.5 * (Inter-quartile range)). The circles are individual outlier points. ** Fruits based products ; *** Vegetables based products
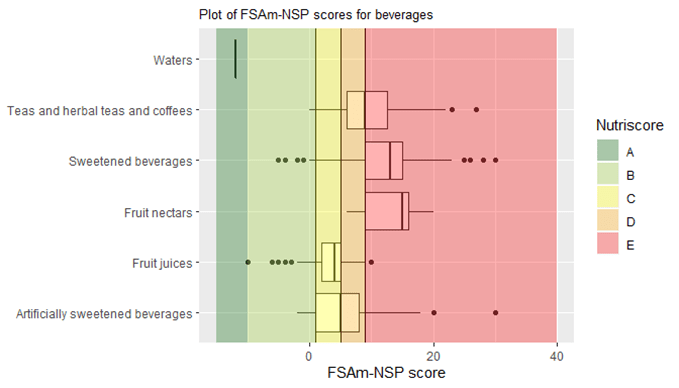
Figure 4: Distribution of the FSAm-NSP score for beverages.
Vertical lines represent the cut-offs of the 5-category Nutriscore. The boundary of the box nearest to the left indicates the 25th percentile, the line within the box marks the median, and the boundary of the box furthest from the left indicates the 75th percentile. Whiskers (error bars) left and right of the box indicate the lower limit (25th percentile – 1.5 * (Inter-quartile range) and the upper limit (75th percentile + 1.5 * (Inter-quartile range)). The circles are individual outlier points. By definition, only water is classified as A and is shown at the top of the plot.
The distribution of the Nutri-Score within the different food groups is displayed in Table 1.
Table 1: Distribution of the Nutri-Score within the different food groups. ** Fruits based products ; *** Vegetables based products.
| A | B | C | D | E | Total | ||
| Fruits and vegetables* | 576(60.9%) | 145(15.3%) | 210(22.2%) | 14(1.5%) | 1(0.1%) | 946 | |
| Vegetables*** | 344(73%) | 66(14%) | 56(11.9%) | 4(0.8%) | 1(0.2%) | 471 | |
| Dried fruits | 17(10.6%) | 44(27.5%) | 94(58.8%) | 5(3.1%) | 0(0%) | 160 | |
| Fruits** | 200(83.7%) | 7(2.9%) | 28(11.7%) | 4(1.7%) | 0(0%) | 239 | |
| Soups | 15(19.7%) | 28(36.8%) | 32(42.1%) | 1(1.3%) | 0(0%) | 76 | |
| Cereals and potatoes | 1002(44.1%) | 420(18.5%) | 494(21.7%) | 308(13.5%) | 50(2.2%) | 2274 | |
| Bread | 124(23%) | 157(29.2%) | 171(31.8%) | 77(14.3%) | 9(1.7%) | 538 | |
| Cereals | 576(60.3%) | 142(14.9%) | 88(9.2%) | 120(12.6%) | 30(3.1%) | 956 | |
| Legumes | 113(67.7%) | 18(10.8%) | 12(7.2%) | 20(12%) | 4(2.4%) | 167 | |
| Potatoes | 39(32.5%) | 37(30.8%) | 38(31.7%) | 5(4.2%) | 1(0.8%) | 120 | |
| Breakfast cereals | 150(30.4%) | 66(13.4%) | 185(37.5%) | 86(17.4%) | 6(1.2%) | 493 | |
| Fish Meat Eggs | 150(12.4%) | 188(15.5%) | 231(19%) | 484(39.9%) | 160(13.2%) | 1213 | |
| Fish and seafood | 67(16%) | 120(28.6%) | 82(19.6%) | 146(34.8%) | 4(1%) | 419 | |
| Meat | 36(10.4%) | 52(15.1%) | 81(23.5%) | 158(45.8%) | 18(5.2%) | 345 | |
| Processed meat | 2(0.5%) | 10(2.5%) | 67(17%) | 177(45%) | 137(34.9%) | 393 | |
| Eggs | 45(86.5%) | 4(7.7%) | 1(1.9%) | 2(3.8%) | 0(0%) | 52 | |
| Offals | 0(0%) | 2(50%) | 0(0%) | 1(25%) | 1(25%) | 4 | |
| Milk and dairy products | 259(10.9%) | 523(22%) | 597(25.1%) | 941(39.5%) | 60(2.5%) | 2380 | |
| Plant-based milk substitutes | 36(24.3%) | 74(50%) | 16(10.8%) | 22(14.9%) | 0(0%) | 148 | |
| Milk and yogurt | 135(16%) | 372(44%) | 271(32.1%) | 64(7.6%) | 3(0.4%) | 845 | |
| Cheese | 46(4.7%) | 41(4.2%) | 187(19%) | 675(68.7%) | 33(3.4%) | 982 | |
| Dairy desserts | 38(20.9%) | 30(16.5%) | 68(37.4%) | 43(23.6%) | 3(1.6%) | 182 | |
| Ice cream | 4(1.8%) | 6(2.7%) | 55(24.7%) | 137(61.4%) | 21(9.4%) | 223 | |
| Fat and sauces | 76(6.4%) | 88(7.4%) | 392(33.1%) | 458(38.6%) | 172(14.5%) | 1186 | |
| Dressings and sauces | 73(8.3%) | 86(9.8%) | 234(26.7%) | 376(42.8%) | 109(12.4%) | 878 | |
| Fats | 3(1%) | 2(0.6%) | 158(51.3%) | 82(26.6%) | 63(20.5%) | 308 | |
| Salty snacks | 64(8.6%) | 56(7.5%) | 263(35.3%) | 290(38.9%) | 72(9.7%) | 745 | |
| Appetizers | 6(2%) | 18(5.9%) | 98(32.3%) | 145(47.9%) | 36(11.9%) | 303 | |
| Nuts | 49(25.1%) | 26(13.3%) | 86(44.1%) | 25(12.8%) | 9(4.6%) | 195 | |
| Salty and fatty products | 9(3.6%) | 12(4.9%) | 79(32%) | 120(48.6%) | 27(10.9%) | 247 | |
| Sugary snacks | 40(1.2%) | 128(3.9%) | 327(10%) | 1051(32.2%) | 1716(52.6%) | 3262 | |
| Biscuits and cakes | 10(0.8%) | 25(2%) | 127(10.1%) | 451(35.7%) | 649(51.4%) | 1262 | |
| Chocolate products | 1(0.1%) | 4(0.5%) | 11(1.4%) | 98(12.9%) | 648(85%) | 762 | |
| Sweets | 29(2.7%) | 98(9.1%) | 166(15.3%) | 424(39.2%) | 365(33.7%) | 1082 | |
| Pastries | 0(0%) | 1(0.6%) | 23(14.7%) | 78(50%) | 54(34.6%) | 156 | |
| Composite foods | 146(13.7%) | 268(25.1%) | 412(38.6%) | 214(20.1%) | 27(2.5%) | 1067 | |
| One-dish meals | 136(17.3%) | 227(29%) | 291(37.1%) | 110(14%) | 20(2.6%) | 784 | |
| Pizza pies and quiches | 4(2.1%) | 25(12.9%) | 96(49.5%) | 63(32.5%) | 6(3.1%) | 194 | |
| Sandwiches | 6(6.7%) | 16(18%) | 25(28.1%) | 41(46.1%) | 1(1.1%) | 89 | |
| Beverages | 141(11.1%) | 122(9.6%) | 273(21.5%) | 255(20.1%) | 477(37.6%) | 1268 | |
| Waters | 140(100%) | 0(0%) | 0(0%) | 0(0%) | 0(0%) | 140 | |
| Teas and herbal teas and coffees | 0(0%) | 6(10.2%) | 2(3.4%) | 26(44.1%) | 25(42.4%) | 59 | |
| Fruit juices | 1(0.3%) | 38(12.9%) | 205(69.7%) | 39(13.3%) | 11(3.7%) | 294 | |
| Fruit nectars | 0(0%) | 0(0%) | 0(0%) | 8(27.6%) | 21(72.4%) | 29 | |
| Artificially sweetened beverages | 0(0%) | 65(33.5%) | 34(17.5%) | 74(38.1%) | 21(10.8%) | 194 | |
| Sweetened beverages | 0(0%) | 13(2.4%) | 32(5.8%) | 108(19.6%) | 399(72.3%) | 552 | |
| Sum | 2454(17.1%) | 1938(13.5%) | 3199(22.3%) | 4015(28%) | 2735(19.1%) | 14341 |
Page break
Results for United-Kingdom
For United-Kingdom, the OpenFoodFact table included 31729 foods. From this list, 22810 products could not be affected to a specific food group and were deleted from the list. Then, 1679 products were removed because the nutritional informations necessary to the calculation of the NutriScore were missing. 16 products were deleted after additionnal quality controls. Finally, the OpenFoodFact table used for this document included 7224 foods. The database contained 487 products composed mainly of fruits and vegetables, 1117 bread and cereal products, 707 meat, fish and eggs products, 1056 milk and dairy, 689 fats and sauces, 655 composite dishes, 1539 sugary snacks, 496 salty snacks. Overall, the mean FSAm-NSP score was 8+/- 9.1 points.
The overall distribution of the FSAm-NSP score is represented in Figure 1.
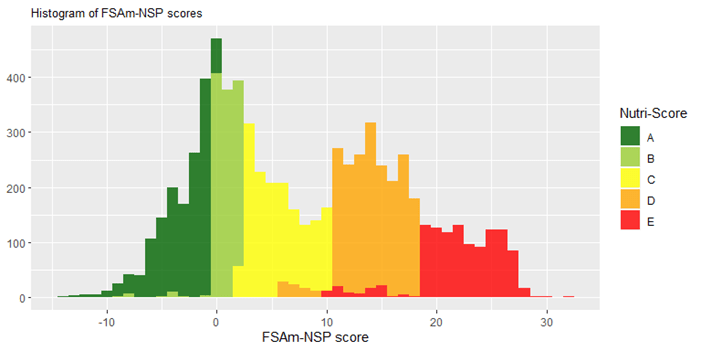
Figure 1: Overall distribution of the FSAm-NSP score
The distribution of the Nutri-Score in the different food groups is represented in Figures 2, 3 and 4.

Figure 2: Distribution of the FSAm-NSP score for solid foods.
Vertical lines represent the cut-offs of the 5-category Nutriscore. The boundary of the box nearest to the left indicates the 25th percentile, the line within the box marks the median, and the boundary of the box furthest from the left indicates the 75th percentile. Whiskers (error bars) left and right of the box indicate the lower limit (25th percentile – 1.5 * (Inter-quartile range) and the upper limit (75th percentile + 1.5 * (Inter-quartile range)). The circles are individual outlier points. *Products containing mainly fruits and vegetables
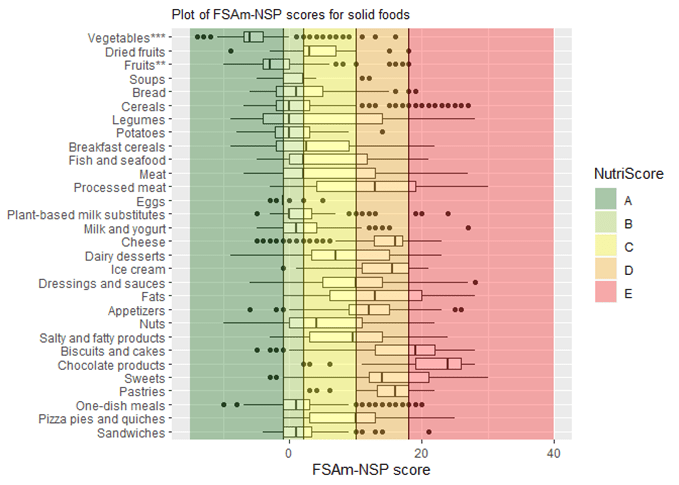
Figure 3: Distribution of the FSAm-NSP score for solid foods in subgroups containing more than 20 items.
Vertical lines represent the cut-offs of the 5-category Nutriscore. The boundary of the box nearest to the left indicates the 25th percentile, the line within the box marks the median, and the boundary of the box furthest from the left indicates the 75th percentile. Whiskers (error bars) left and right of the box indicate the lower limit (25th percentile – 1.5 * (Inter-quartile range) and the upper limit (75th percentile + 1.5 * (Inter-quartile range)). The circles are individual outlier points. ** Fruits based products ; *** Vegetables based products
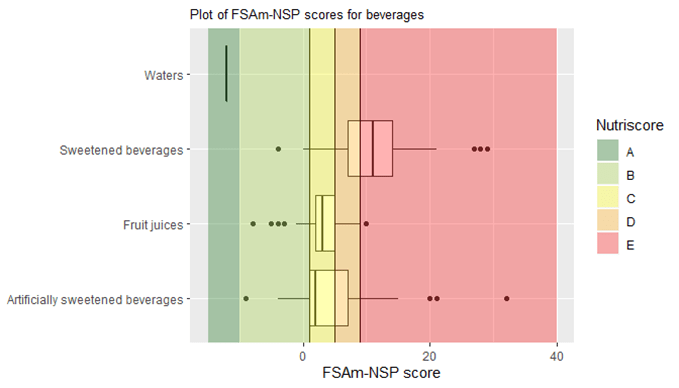
Figure 4: Distribution of the FSAm-NSP score for beverages.
Vertical lines represent the cut-offs of the 5-category Nutriscore. The boundary of the box nearest to the left indicates the 25th percentile, the line within the box marks the median, and the boundary of the box furthest from the left indicates the 75th percentile. Whiskers (error bars) left and right of the box indicate the lower limit (25th percentile – 1.5 * (Inter-quartile range) and the upper limit (75th percentile + 1.5 * (Inter-quartile range)). The circles are individual outlier points. By definition, only water is classified as A and is shown at the top of the plot.
The distribution of the Nutri-Score within the different food groups is displayed in Table 1.
Table 1: Distribution of the Nutri-Score within the different food groups. ** Fruits based products ; *** Vegetables based products.
| A | B | C | D | E | Total | ||
| Fruits and vegetables* | 325(66.7%) | 70(14.4%) | 79(16.2%) | 13(2.7%) | 0(0%) | 487 | |
| Vegetables*** | 209(84.3%) | 17(6.9%) | 18(7.3%) | 4(1.6%) | 0(0%) | 248 | |
| Dried fruits | 7(11.1%) | 17(27%) | 37(58.7%) | 2(3.2%) | 0(0%) | 63 | |
| Fruits** | 95(72%) | 15(11.4%) | 17(12.9%) | 5(3.8%) | 0(0%) | 132 | |
| Soups | 14(31.8%) | 21(47.7%) | 7(15.9%) | 2(4.5%) | 0(0%) | 44 | |
| Cereals and potatoes | 482(43.2%) | 218(19.5%) | 224(20.1%) | 162(14.5%) | 31(2.8%) | 1117 | |
| Bread | 102(36.8%) | 76(27.4%) | 57(20.6%) | 41(14.8%) | 1(0.4%) | 277 | |
| Cereals | 187(49.9%) | 86(22.9%) | 54(14.4%) | 28(7.5%) | 20(5.3%) | 375 | |
| Legumes | 65(48.9%) | 6(4.5%) | 19(14.3%) | 34(25.6%) | 9(6.8%) | 133 | |
| Potatoes | 26(46.4%) | 14(25%) | 15(26.8%) | 1(1.8%) | 0(0%) | 56 | |
| Breakfast cereals | 102(37%) | 36(13%) | 79(28.6%) | 58(21%) | 1(0.4%) | 276 | |
| Fish Meat Eggs | 146(20.7%) | 165(23.3%) | 127(18%) | 192(27.2%) | 77(10.9%) | 707 | |
| Fish and seafood | 44(19.5%) | 75(33.2%) | 44(19.5%) | 60(26.5%) | 3(1.3%) | 226 | |
| Meat | 59(25.4%) | 62(26.7%) | 34(14.7%) | 59(25.4%) | 18(7.8%) | 232 | |
| Processed meat | 2(1%) | 25(12.6%) | 46(23.2%) | 69(34.8%) | 56(28.3%) | 198 | |
| Eggs | 41(91.1%) | 3(6.7%) | 1(2.2%) | 0(0%) | 0(0%) | 45 | |
| Offals | 0(0%) | 0(0%) | 2(33.3%) | 4(66.7%) | 0(0%) | 6 | |
| Milk and dairy products | 161(15.2%) | 235(22.3%) | 227(21.5%) | 393(37.2%) | 40(3.8%) | 1056 | |
| Plant-based milk substitutes | 23(23%) | 50(50%) | 14(14%) | 10(10%) | 3(3%) | 100 | |
| Milk and yogurt | 121(26.8%) | 169(37.4%) | 135(29.9%) | 26(5.8%) | 1(0.2%) | 452 | |
| Cheese | 12(3%) | 9(2.2%) | 50(12.5%) | 306(76.5%) | 23(5.8%) | 400 | |
| Dairy desserts | 4(8.7%) | 5(10.9%) | 17(37%) | 19(41.3%) | 1(2.2%) | 46 | |
| Ice cream | 1(1.7%) | 2(3.4%) | 11(19%) | 32(55.2%) | 12(20.7%) | 58 | |
| Fat and sauces | 28(4.1%) | 56(8.1%) | 264(38.3%) | 261(37.9%) | 80(11.6%) | 689 | |
| Dressings and sauces | 27(5.2%) | 50(9.5%) | 205(39.1%) | 210(40.1%) | 32(6.1%) | 524 | |
| Fats | 1(0.6%) | 6(3.6%) | 59(35.8%) | 51(30.9%) | 48(29.1%) | 165 | |
| Salty snacks | 39(7.9%) | 54(10.9%) | 161(32.5%) | 203(40.9%) | 39(7.9%) | 496 | |
| Appetizers | 6(2.4%) | 14(5.6%) | 81(32.3%) | 126(50.2%) | 24(9.6%) | 251 | |
| Nuts | 21(20%) | 23(21.9%) | 32(30.5%) | 27(25.7%) | 2(1.9%) | 105 | |
| Salty and fatty products | 12(8.6%) | 17(12.1%) | 48(34.3%) | 50(35.7%) | 13(9.3%) | 140 | |
| Sugary snacks | 17(1.1%) | 43(2.8%) | 133(8.6%) | 594(38.6%) | 752(48.9%) | 1539 | |
| Biscuits and cakes | 8(1.1%) | 19(2.6%) | 64(8.9%) | 257(35.8%) | 369(51.5%) | 717 | |
| Chocolate products | 0(0%) | 1(0.3%) | 2(0.7%) | 61(20.7%) | 230(78.2%) | 294 | |
| Sweets | 9(1.9%) | 23(4.8%) | 60(12.6%) | 245(51.3%) | 141(29.5%) | 478 | |
| Pastries | 0(0%) | 0(0%) | 7(14%) | 31(62%) | 12(24%) | 50 | |
| Composite foods | 188(28.7%) | 231(35.3%) | 139(21.2%) | 82(12.5%) | 15(2.3%) | 655 | |
| One-dish meals | 167(35.2%) | 181(38.1%) | 89(18.7%) | 34(7.2%) | 4(0.8%) | 475 | |
| Pizza pies and quiches | 1(0.9%) | 23(20.5%) | 36(32.1%) | 42(37.5%) | 10(8.9%) | 112 | |
| Sandwiches | 20(29.4%) | 27(39.7%) | 14(20.6%) | 6(8.8%) | 1(1.5%) | 68 | |
| Beverages | 63(13.2%) | 73(15.3%) | 161(33.7%) | 80(16.7%) | 101(21.1%) | 478 | |
| Waters | 63(100%) | 0(0%) | 0(0%) | 0(0%) | 0(0%) | 63 | |
| Teas and herbal teas and coffees | 0(0%) | 2(14.3%) | 3(21.4%) | 4(28.6%) | 5(35.7%) | 14 | |
| Fruit juices | 0(0%) | 22(14.4%) | 107(69.9%) | 19(12.4%) | 5(3.3%) | 153 | |
| Fruit nectars | 0(0%) | 0(0%) | 1(100%) | 0(0%) | 0(0%) | 1 | |
| Artificially sweetened beverages | 0(0%) | 44(36.1%) | 36(29.5%) | 28(23%) | 14(11.5%) | 122 | |
| Sweetened beverages | 0(0%) | 5(4%) | 14(11.2%) | 29(23.2%) | 77(61.6%) | 125 | |
| Sum | 1449(20.1%) | 1145(15.8%) | 1515(21%) | 1980(27.4%) | 1135(15.7%) | 7224 |
Page break
Conclusion
Overall, the distribution of the FSAm-NSP score displayed a high variability in the 13 countries, confirming its validity for use in the 5-category label Nutri-Score in different sociocultural contexts. Moreover, the distribution in the FSAm-NSP score showed a high consistency between the classification and dietary recommendations: overall, products composed mainly of fruits and vegetables, bread and cereals scored consistently more favorably than sugary or salty snacks. Composite dishes displayed a very large distribution, highlighting the variability of the products in this specific category.
The classification of the different food groups in the Nutri-Score displayed a high consistency with nutritional recommendations: the majority of products containing mainly fruits and vegetables were classified as A or B , while a majority of sugary snacks were classified as D or E. This variability was also displayed within food groups: in the bread and cereals group, legumes + pasta and rice were consistently better classified than breakfast cereals; in dairy, milk and yogurt were better classified than cheese.
Finally, in beverages, while a majority of fruit juices were classified as C, soft drinks were classified as E, consistently with nutritional recommendations.
Overall, the discriminating power of the Nutri-Score (number of categories in the Nutri-Score available for each food group) was high, as foods were classified in more than 3 categories of the Nutri-Score, both for food groups and for subgroups of foods.
Therefore, overall, the Nutri-Score displays a high consistency with nutritional recommendations, and allows consumers to graps the very high variability in the nutritional composition of foods. The discriminating power of the Nutri-Score can be used to help consumers making healthier choices at the point of purchases, by displaying with at-a-glance labelling the nutritional quality of products.
Page break
References
- Julia C, Ducrot P, Peneau S et al. Discriminating nutritional quality of foods using the 5-Color nutrition label in the French food market: consistency with nutritional recommendations. Nutr J. 2015;14:100.
- Szabo de Edelenyi F, Egnell M, Galan P, Druesne-Pecollo N, Hercberg S and Julia C. Ability of the Nutri-Score front-of-pack nutrition label to discriminate the nutritional quality of foods in the German food market and consistency with nutritional recommendations. Arch Public Health. 2019;77:28.
- Rayner M, Scarborough P, Stockley L, and Boxer A. Nutrient profiles: development of Final model. Final Report . Available from: https://www.researchgate.net/publication/266447771_Nutrient_profiles_Development_of_Final_Model_Final_Report.
- Rayner M, Scarborough P, and Stockley L. Nutrient profiles: Applicability of Currently Proposed Model for Uses in Relation to Promotion of Foods in Children Aged 5-10 and Adults. [Internet]. Available from: https://www.researchgate.net/publication/267952402_Nutrient_profiles_Applicability_of_currently_proposed_model_for_uses_in_relation_to_promotion_of_food_to_children_aged_5-10_and_adults.
- Rayner M, Scarborough P, and Lobstein T. The UK Ofcom Nutrient Profiling Model – Defining ‘healthy’ and ‘unhealthy’ food and drinks for TV advertising to children. [Internet] Available from: https://www.ndph.ox.ac.uk/cpnp/files/about/uk-ofcom-nutrient-profile-model.pdf.
- ANSES. Evaluation de la faisabilité du calcul d’un score nutritionnel tel qu’élaboré par Rayner et al. Rapport d’appui scientifique et technique.ANSES :Maison Alfort. Available from: https://www.anses.fr/fr/system/files/DER2014sa0099Ra.pdf.
- Haut Conseil de la Santé Publique. Avis relatif à l’information sur la qualité nutritionnelle des produits alimentaires. Paris :HCSP. Availablefrom: http://www.hcsp.fr/Explore.cgi/avisrapportsdomaine?clefr=519.
1 Université Paris 13, Equipe de Recherche en Epidémiologie Nutritionnelle (EREN), Centre de Recherche en Epidémiologie et Statistiques, Inserm (U1153), Inra(U1125), Cnam, COMUE Sorbonne Paris Cité, F-93017 Bobigny, France.
2 Département de Santé Publique, Hôpital Avicenne (AP-HP), F-93017 Bobigny, France
